

Signal + Noise vs. Signal: Don't Make This Classic Mistake
Signal + Noise vs. Signal: Don't Make This Classic Mistake
Day three of classical posts on global warming, now “climate change”. Your author has many bona fides and much experience in this field: see this.
Announcement. I am on vacation this week preparing for the Cultural Event of the Year. This post originally ran 18 September 2017. This exposes a common fallacy which I like to call—ladies, avert your eyes—The Deadly Sin Of Reification.
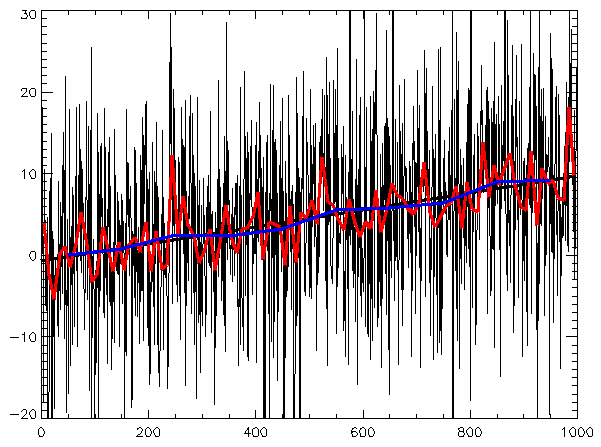
If in this picture we imagine these are atmospheric concentrations or stock price anomalies, this is a terrific example of reification, or replacing what did happen with what did not.
Update I see that I failed below to demonstrate the ubiquity of the problem. So your homework is to search “testing trend time series” and similar terms and discover for yourself. Any kind of hypothesis test used on a time series counts.
My impetus was in reading an article about a paper some colleagues and I wrote about atmospheric ammonia. The author wrote, “The statistical correlation between hourly ammonia concentrations between measurement stations is weak due to large variability in local agricultural practice and in weather conditions. If data are aggregated to longer time scales, correlations between stations clearly increase due to the removal of noise at the hourly timescale.”
There’s the belief in “noise”, which does not exist, and there’s also the second (bigger) mistake, which is measuring correlation of time series after smoothing, which increases (in absolute value) the correlation (as has been proved here and Uncertainty_ many, many, many times). This happens even for two strings of absolutely unrelated, made-up numbers. Try it yourself.
So you just look for mentions of “noise” in stock prices, and so on and see if I’m right about the scale of the problem.
Original article
Two weeks ago the high temperature on the wee island upon which I live was 82F (given my extreme sloth, I am making all details up).
Now for the non-trick question: What was the high temperature experienced by those who went out and about on that day?
If you are a subscriber to the signal+noise form of time series modeling, then your answer might be 78F, or perhaps 85F, or even some other figure altogether. But if you endorse the signal form of time series modeling, you will say 82F.
Switch examples. Three days back, the price of the Briggs Empire stock closed at $52 (there is only one share). Query: what was the cost of the stock at the close of the day?
Signal+noise folks might say $42.50, whereas signal people will say $52.
Another example. I was sitting at the radio AM DXing, pulling in a station from Claxton, Georgia, WCLA 1470 AM. The announcer came on and through the heavy static I thought I heard him give the final digit of a phone number as “scquatch”, or perhaps it was “hixsith”.
Here are two questions: (1) What number did I hear? (2) What number did the announcer say?
The signal+noise folks will hear question (1) but give the answer to (2) (they will answer (2) twice), whereas the signal folks will answer (1) with “scquatch or hixsith”, and answer (2) by saying, “Hey signal+noise guys, a little hand here?”
We have three different “time series”: temperature, stock price, radio audio. It should be obvious that everybody experiences the “numbers” or “values” of each of these series as they happen. If it is 82F outside, you feel the 82F and not another number (and don’t give me grief about fictional “heat indexes”); if the price is $52, that is what you will pay; if you hear “scquatch”, that is what you hear. You do not experience some other value to which ignorable noise has been added.
For any time series (and “any” include our three), some thing or things caused each value. A whole host of physical states caused the 82 degrees; the mental and monetary states of a host of individuals caused the $52; a man’s voice plus antenna plus myriad other physical states (ionization of certain layers of the atmosphere, etc.) caused “scquatch” to emerge from the radio’s speakers.
In each case, if we knew—really knew—what these causes were, we would not only know the values, which we already knew because we experienced them, but we could predict with certainty what the coming values would be. Yet this list of causes will really only be available in artificial circumstances, such as simulations.
Of the three examples, there was only one in which there was a true signal hidden by “noise”, where noise is defined as that which is not signal. Temperature and stock price were pure signal. But all three are routinely treated in time series analysis as if they were composed of signal+noise. This mistake is caused by the Deadly Sin of Reification.
No model of any kind is needed for temperature and stock price; yet models are often introduced. You will see, indeed it is vanishingly rare not to see, a graph of temperature or price over-plotted with a model, perhaps a running-mean or some other kind of smoother, like a regression line. Funny thing about these graphs, the values will be fuzzed out or printed in light ink, while the model appears as bold, bright, and thick. The implication is always that the model is reality and values a corrupted form of reality. Whereas the opposite is true.
The radio audio needs a model to guess what the underlying reality was given the observed value. We do not pretend in these models to have identified the causes of the reality (of the values), only that the model is conditionally useful putting probabilities on possible real values. These models are seen as correlational, and nobody is confused. (Actual models, depending on the level of sophistication, may have causal components, but since the number of causes will be great in most applications, these models are still mostly correlational.)
We agreed there will be many causes of temperature and stock price values. One of the causes of temperature is not season—how could the words “autumn” cause a temperature?—though we may condition on season (or date) to help us quantify our uncertainty in values. Season is not a cause, because we know there are causes of season, and that putting “season” (or date) into a model is only a crude proxy for knowledge of these causes.
Given an interest in season, we might display a model which characterizes the average (or some other measure) of uncertainty we might have in temperature values by season (or date), and from this various things might be learned. We could certainly use such a model to predict temperature. We could even say that our 82F was a value so many degrees higher or lower than some seasonal measure. But that will not make the 82F less real.
That 82F was not some “real” seasonal value corrupted by “noise”. It cannot be because season is not a cause: amount of solar insolation, atmospheric moisture content, entrainment of surrounding air, and on and on are causes, but not season.
Meteorologists do attempt a run at causes in their dynamic models, measuring some causes directly and others by proxy and still others by gross parameterization, but these dynamical models do not make the mistake of speaking of signal+noise. They will say the temperature was 82F because of this-and-such. But this will never be because some pure signal was overridden by polluting noise.
The gist is this. We do not need statistical models to tell us what happened, to tell us what values were experienced, because we already know these. Statistical models are almost always nothing but gross parameterization and are thus only useful in making predictions, thus they should only be used to guess the unknown. We certainly do not need them to tell us what happened, and this includes saying whether a “trend” was observed. We need only define “trend” and then just look.
Why carp about this? Because the signal+noise view brings in the Deadly Sin of Reification (especially in stock prices, where everybody is an after-the-fact expert), and that sin leads to the worse sin of over-certainty. And we all know where that leads.
Addendum
“But, Briggs. What if we measured temperature with error?”
Great question. Then we are in the radio audio case, where we want to guess what the real values were given our observation. There will be uncertainty in these guesses, some plus-or-minus to every supposed value. This uncertainty must always be carried “downstream” in all analyses of the values, though it very often isn’t. Guessing temperatures by proxy is a good example.
I have more on this topic in Uncertainty: The Soul of Modeling, Probability & Statistics.
Subscribe or donate to support this site and its wholly independent host using credit card click here. Or use the paid subscription at Substack. Cash App: $WilliamMBriggs. For Zelle, use my email: matt@wmbriggs.com, and please include yours so I know who to thank.
The conundrum never leaves. Referring to noise is valid. We have to try to remove the noise from the stream. So we do things. We time weight the input. We mass weight the input. We volume weight the input. Anything to try and remove the instantaneous oscillations in the system. Our power plant models blew up when we did live analysis. A change in the dynamic state of the system would make Efficiencies look either impossible or depressing. So we didn't use instantaneous readings for calculations. That meant our analysis was always 5 to 15 minutes behind.
But then NOISE as in deterrents to analysis becomes NOISE as in deterrents to getting the answer that makes us happy. The first version -- averaging is a necessary evil. The second version -- the average is what bends you over the barrel and makes many daily activities hard.
Averages are your friend. They will FUBAR you without hesitation.
I just had my first wacky experience with twitter. Mostly people do not respond. Then Boraxgate happened. O No another Tide Pod scandal. Wait, she just put less than a pinch in her water. I am not saying I would do it, but we aren't in tide pod eating territory here. We are in o look someone is creating a gatorade product without paying for gatorade.. You would think that people with credentials associated with Medicine would understand that the dose makes the poison.
They do not. I can see though how making wild ass comments to get feedback might be motivational. The mundane is boring.
Smoothing before embarking on (un)godly quest for correlations can loosely be likened to rounding up each number before calculating their average (and then rounding up that, and so forth, but of course 🤸).