WHO PCR Test False Positive Fiasco: Coronavirus Update L
WHO KNEW
The WHO last week admonished the world to watch the Ct level of PCR tests. Too high gives too many false positives. False positives artificially boost "case" numbers, and high "case" numbers prolong the panic.
Reminder: What the media calls "cases" are largely asymptomatic to low grade infections, with some number of false positives.
We have an article on the WHO fiasco that just came out:
PCR stands for "polymerase chain reaction." PCR amplifies ("cycles") sequences of nucleic acid (DNA and RNA). The test takes a tiny sample from a swab of mucus and creates a much larger sample. This amplification makes it much easier for instruments to detect the virus. But that means that if a sample is over-cycled, it might produce a positive result for the coronavirus, even though no active virus is present. A patient might only have little fragments of nucleic acid floating around in his system, but he's neither sick nor contagious...
In PCR tests, running more cycles, raising the "cycle threshold" or Ct, is like cranking up the knob on [an amp subject to feedback]. A PCR test keeps doubling whatever is in the original sample until it detects the virus. The earlier it finds something, the more likely it's dealing with an active infection. As Science magazine explained back in September, "A test that registers a positive result after 12 rounds, for a Ct value of 12, starts out with more than 10 million times as much viral genetic material as a sample with a CT value of 35."
If it only detects viral material after, say, 37 to 40 cycles, then the test should be counted as negative...[but often isn't]...
Until a few weeks ago, the Kansas Department of Health and Environment’s Health and Environmental Laboratories was running the test up to 42 cycles. Then, without fanfare, they quietly reduced that to 35.
Let's see how this looks in the numbers. Here is the daily positivity rate of tests (data sources below):
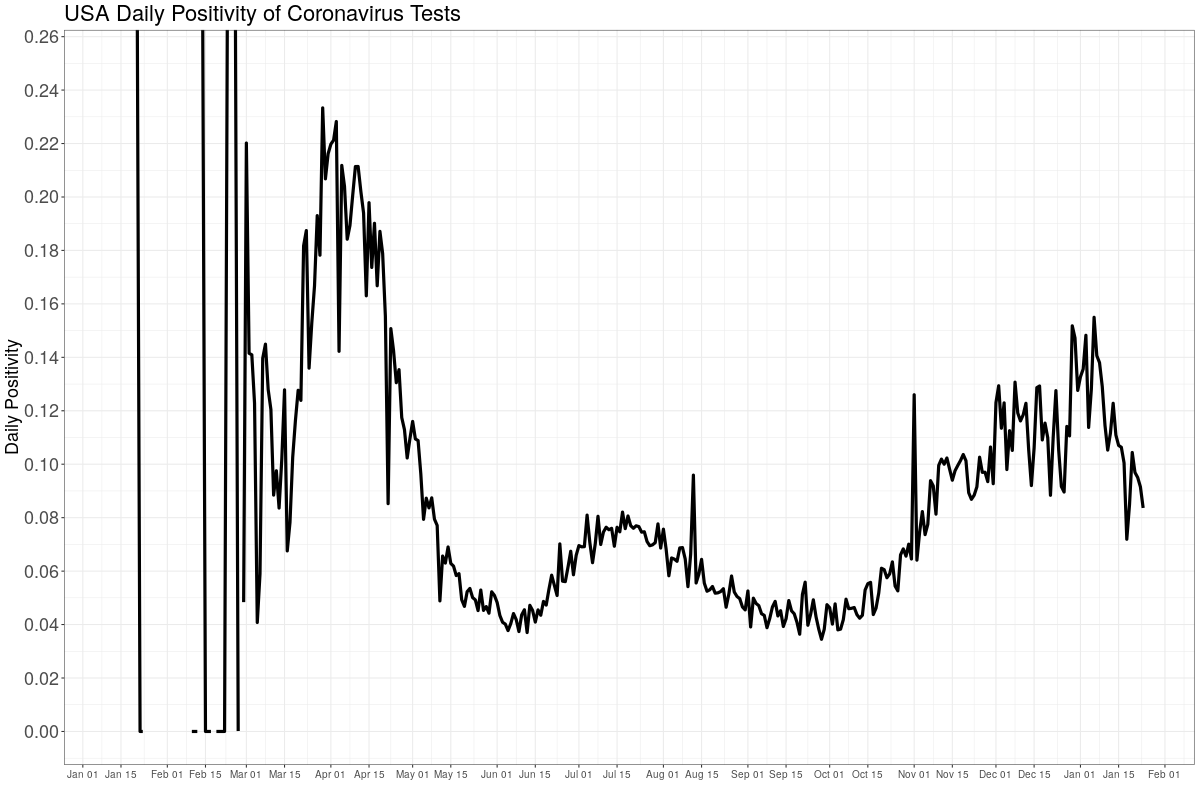
Ignore the wild swings at the beginning, which are caused by small numbers. The peak at 1 April coincides with the number of attributed deaths peak. As does the smaller mid-July peak, which matches when the coronadoom first expanded to the South and West.
Look close at around Thanksgiving and Christmas. Flat-ish. This is because of the large number of increased tests for people traveling, most of which were negative. There is then an expected sharp drop in tests (not positivity) around Christmas, and later again at New Years. This can boost positivity as it's more likely people who suspect they're ill show up to be tested, while everybody else stays home to celebrate.
Normally I put the daily number of tests in the NUMBERS section, but we need it here. Note that, like below, these numbers aren't beset by late counts like CDC death numbers (or are by very little). So this graph's history won't change.
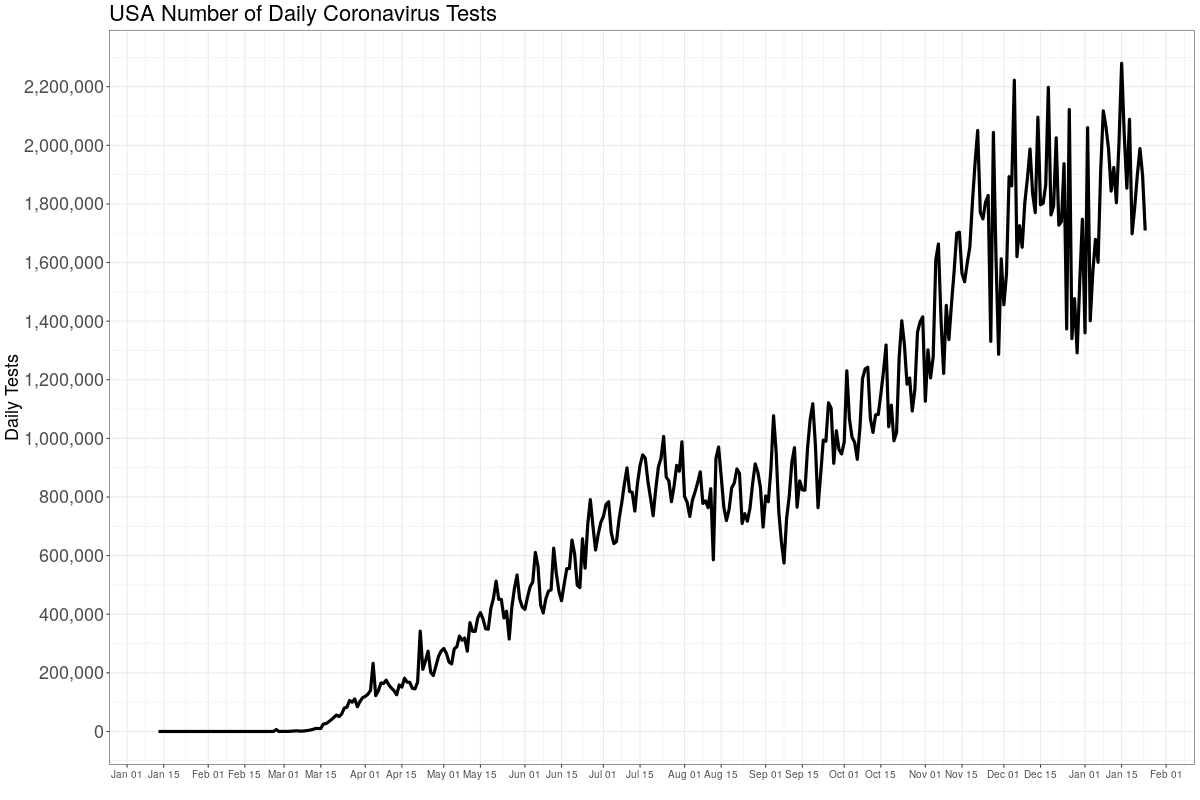
Tests re-peaked after the holiday, and have dropped slightly since the 15th.
Positivity (the graph above) is dropping rapidly. That implies at least two things are happening:
1) Lower Cts, fewer false positives. The WHO's admonition, and the politics of the coronadoom, necessitate a lowering of "cases"---and with lower "cases" comes lower attributed deaths. We'll see that below.
We already saw some localities lowered their Ct; it's likely others have and will continue to do so.
2) Coming of spring.. Below, and for many, many, many weeks I have been shouting that deaths would peak around the first week or two of January---as they always do---and then begin to subside as it gets warmer. Not so warm in the Northeast now, but it is warmer in the south.
Authorities will take credit for this drop (weather and finally sensible Ct levels). It will be nauseating to endure their boasts, but at this point, we will all be glad for this nonsense to end as soon as possible.
VACCINE
Hank Aaron died last week, after his vaccine. No cause of death was given for him anywhere that I could discover.
I'm also hearing---as predicted!---rumors from unnamed professionals that the efficacy of the vaccine in the wild is much lower than the experimentally observed 90+%. I warned everybody it would decrease, likely to around 50%, a "regression to the mean" that happens to all drugs once they're released.
Drug companies can tightly control experimental data, and experiments, but they're subject to the winds after the drug is in the hands of real people.
BOOK UPDATE
The book is back in stock! The Price of Panic.
The price is still $12.99 for the hardback. You can't afford not to buy.
https://twitter.com/anmaheca/status/1349486695952097281
Website of similar name: price of panic.
THE NUMBERS
Sources: daily tests, CDC official toll number one, number two (the old weekly file, now suspect). Deaths by age. Covid & flu. WHO flu tracker. All current as of Monday night.
CDC weekly ALL CAUSE death counts, or the Perspective Plot, from late 2009 until now. The late drop off is late counting: it takes up to eight weeks to get all data, but most are in by three. We need to look at all cause deaths because we can't quite trust the attributed COVID numbers.
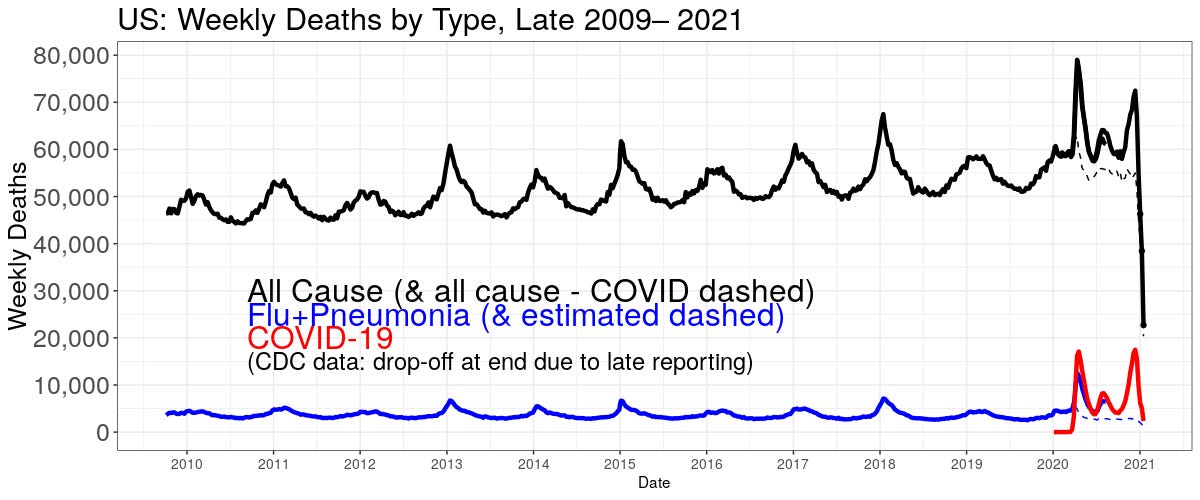
The black line is deaths of any kind. The red is COVID. The blue line is flu+pneumonia (it's the pneumonia that kills most flu patients). The blue is estimated starting mid year because CDC stopped separate reporting on flu. The suspicion is some flu and pneumonia deaths are being attributed to COVID.
You can see the initial peak in 2020, when the virus first hit in the northeast, and then a smaller bump when it spread south. The bump now is in line, and perhaps a bit higher, with what we expect to see this time of year on average.
DEATHS ALWAYS PEAK IN MID JANUARY, THEN DROP. EVEN WITHOUT GOVERNMENT INTERVENTION PLEASE PASS THIS INFORMATION ON!
The January peaks are caused when we enter our voluntary lockdowns in winter, spreading bugs. This is also the "solution" governments hit upon to stop the spread of bugs. Lockdowns kill.
Here is the CDC deaths "involving" COVID.
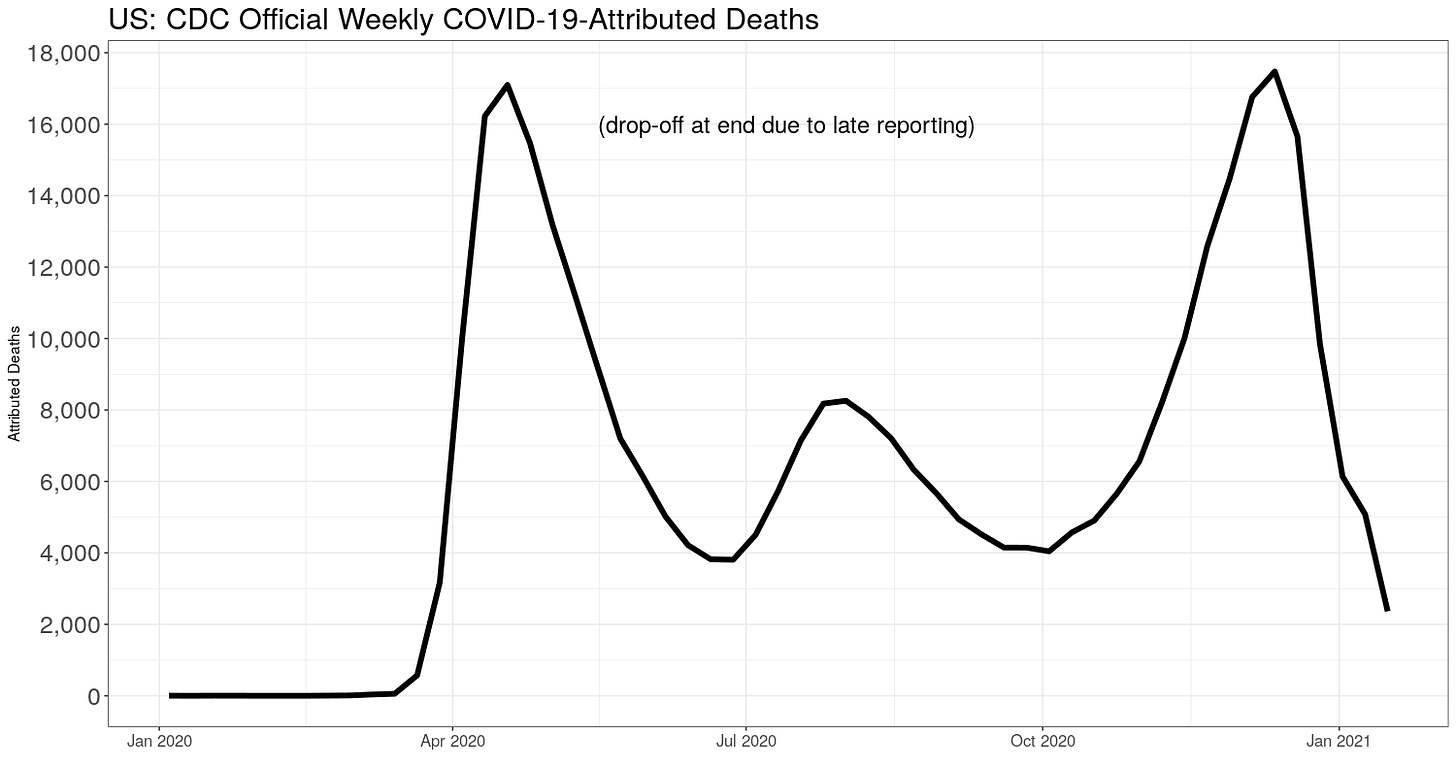
Even with late counting it's clear attributed deaths are on their way down---as we have been predicting. There is also concern some of these attributed deaths are flu or pneumonia and not COVID per se.
Here is another way to look at all deaths, the week-of-the-year all-cause deaths.
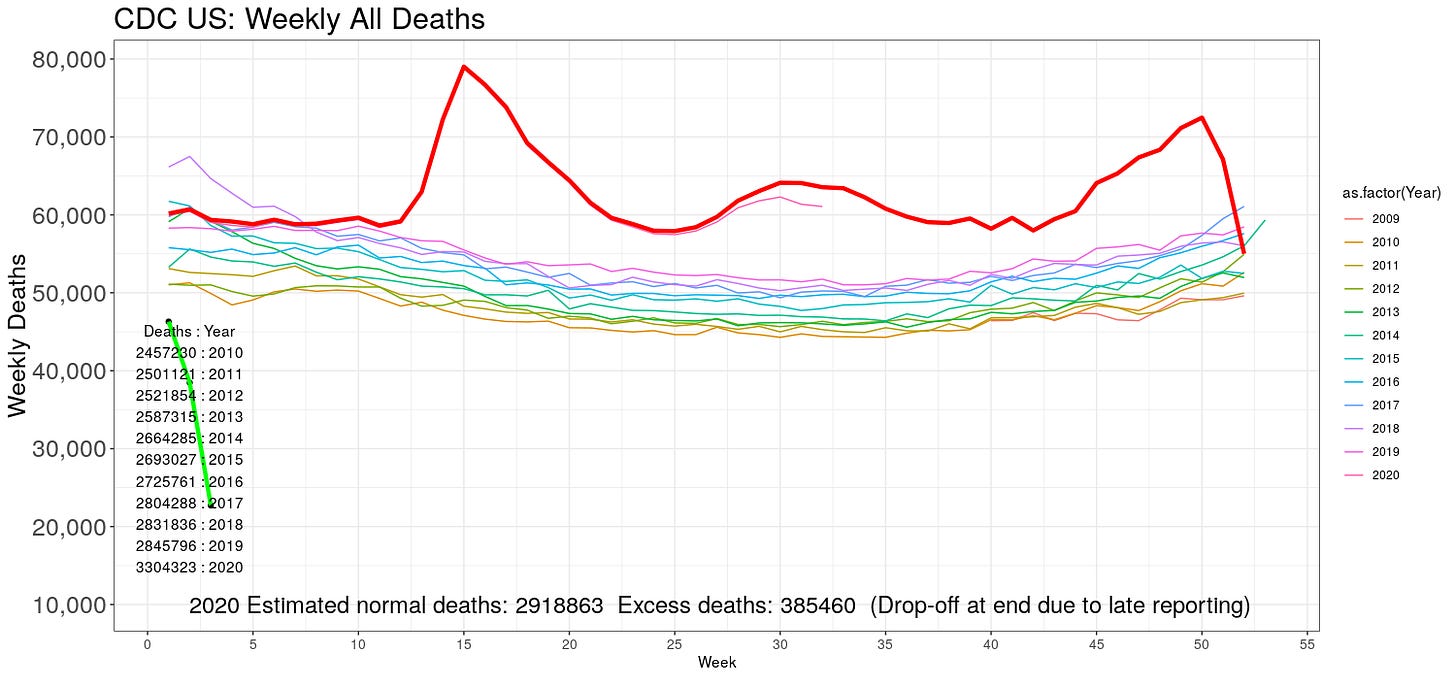
The 2020 estimated "excess" deaths (using my extrapolation model) are closing in. About 385 thousand. This will rise a bit with late counts.
IMPORTANT: these are not all COVID deaths! They include deaths from the "solution" to COVID, too. Plus increased suicides, cancers, heart attacks, and everything else due to lockdowns.
The green line at the left are 2021 numbers; obvious under-counts. I include them to show where we are.
Flu is still missing, even into 2021. CDC found one pediatric death for flu this season. Here is the WHO's global flu tracker, which still shows flu has gone missing everywhere:
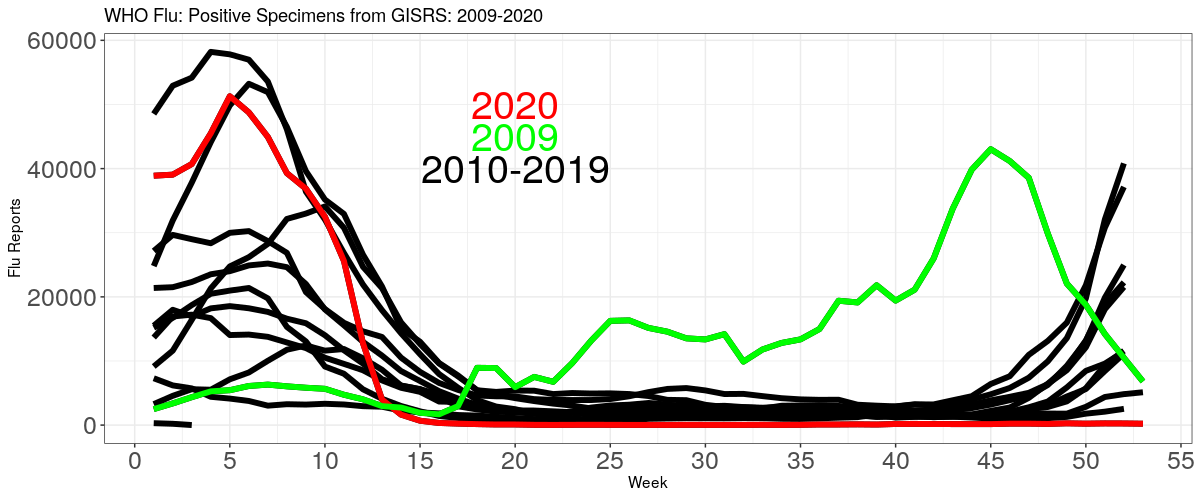
The black line at the bottom far left is 2021. I'll color this next week. Flu is still gone the world over. Leading us to suspect some COVID deaths are really flu+pneumonia.
Here is the CDC official population mortality rates for the all causes other than COVID, and "involving" COVID (with and of; "involving" is CDC's word).
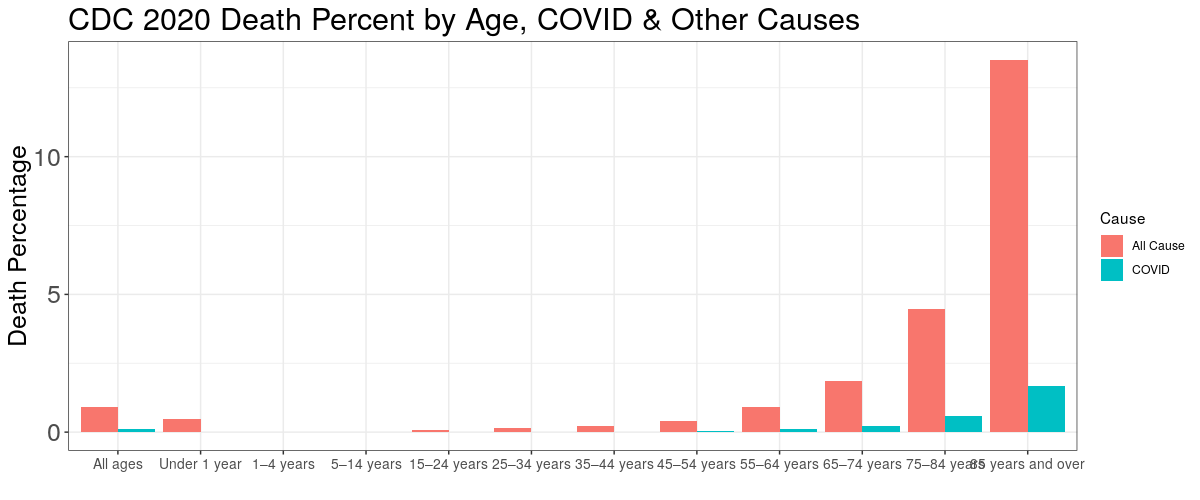
Here are the same population fatality rates in tabular form:
POPULATION FATALITY RATES
                 Age     COVID OtherCause
1       Under 1 year 0.0000100    0.00490
2          1–4 years 0.0000013    0.00021
3         5–14 years 0.0000014    0.00013
4        15–24 years 0.0000120    0.00081
5        25–34 years 0.0000500    0.00150
6        35–44 years 0.0001400    0.00230
7        45–54 years 0.0004000    0.00420
8        55–64 years 0.0009600    0.00920
9        65–74 years 0.0023000    0.01900
10       75–84 years 0.0060000    0.04500
11 85 years and over 0.0170000    0.14000
No matter what age, there is at least about a 10 times or larger chance of dying from something else then COVID. If you're under 44, the COVID risk is tiny. Our level of fear is in not in line with the actual risk for the majority of the population.
About masks in depth, see this article and this one. I am also working on a comprehensive article about masks. Hint: they do not work.
To support this site and its wholly independent host using credit card or PayPal (in any amount) click here


