

Over-Certainty Is One Of The Main Causes Of Bad Science: Brain Volume & IQ Example
Over-Certainty Is One Of The Main Causes Of Bad Science: Brain Volume & IQ Example
Announcement Next week I am on vacation as I prepare for the Cultural Event of the year. There will be no new posts: there may be classic reposts.
Don't miss JH's and my comment at the blog: I mixed up their label; rather, mistook it. My apologies to readers. The lesson still stands, though, with the proper label. I'll leave the original so all can see my blunder; I'll put a couple comments in brackets in the main text.
Scientific over-certainty is much easier to generate than you might have thought, because of Truth everybody believes, but never of himself, that the easier person to fool is yourself. (This began as a Twitter thread.)
Here’s an example of how easy it is to fool yourself into over-certainty, from a paper on predicting a score on a test (“IQ”) from observed volume of brain matter. The peer-reviewed paper is “Predicting intelligence from brain gray matter volume” by Hilger and others in Brain Structure and Function.
The plausible idea is that on the whole or in regions, greater brain matter predicts higher test scores; which is to say, higher IQ. I have many quibbles (here, here) with the idea that IQ—a score on a test—-is intelligence, that all aspects of intelligence can be comprised into one number, and measured with little or no ambiguity.
But let’s ignore all that here and acknowledge IQ test scores do go part way into measuring some important aspects of intelligence. Given our culture is saturated in the curious brain-as-computer metaphor, and given other experiences in biology, it far from a crazy idea to suggest that the bigger the brain the more intelligent the brain-bearer (how’s that for a woke term!).
Now, when we make predictions, we usually want to know things like this: Given X, what will Y be, plus or minus? Here that translates to something like this: Given cerebellum volume, what will a person’s test score be, +/-?
What’s done, usually, is that for many observed values of X and Y, we plot the old fashioned scatter plot, with X on the x-axis and Y on the y-axis. Prediction to Predicted. You’ve seen this many times.
But I’ve been noticing that, lately, an inversion of this process.
Here is one of their models, using cerebellar volume and score:
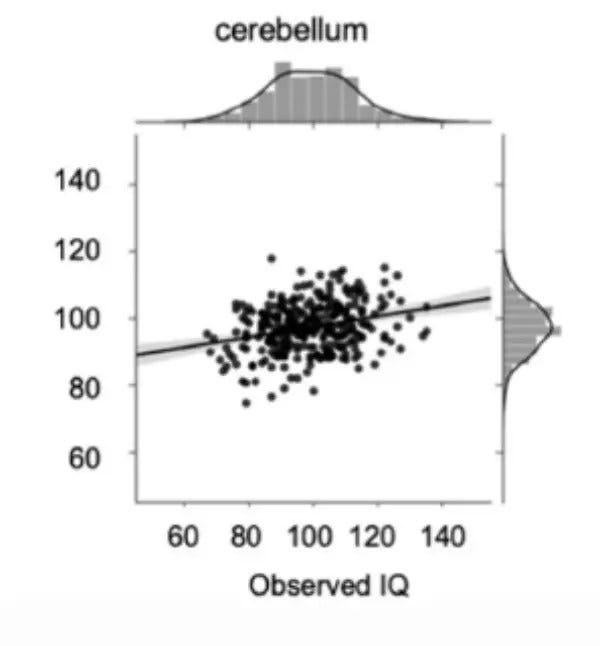
Can you spot the mistakes?
Mistake #1, which is almost impossible to resist, is to assume that straight line is Reality. The eye is inexorably drawn to it. How easy it is to assume this is the Way Things Are!
That mistake is not the authors’. It is our mistake when we read the results. This error is ubiquitous. It is called—ladies, avert your eyes—the Deadly Sin of Reification.
Meaning that when this model is talked about, all that is remembered is that line. The dots, i.e. Reality, fade away; only the model is remembered. Many such cases.
Mistake #2, the gray shade around the line gives uncertainty in some part of the guts of the model. It says nothing about Reality itself. It is not the predictive error (it’s the parametric uncertainty in the model itself, which is of no interest to man or beast).
Because the line is narrow, it means a wee p has been found, and “significance” is declared. This is also ubiquitous error.
Those errors are, as I said, everywhere, and would not warrant this article. The next mistake does.
Mistake #3, the orientation of the graph. X is on the y-axis, and vice versa. The line is drawn as if Y is predicting X – which is not what the paper’s title promised us.
Because of this slip, the model seems pretty good. Sure, there’s scatter around the line, but not terrible. We are led to believe that the model is pretty good.
Here’s the same thing, but flipped in the proper orientation, and with a guess of the predictive model’s uncertainty.
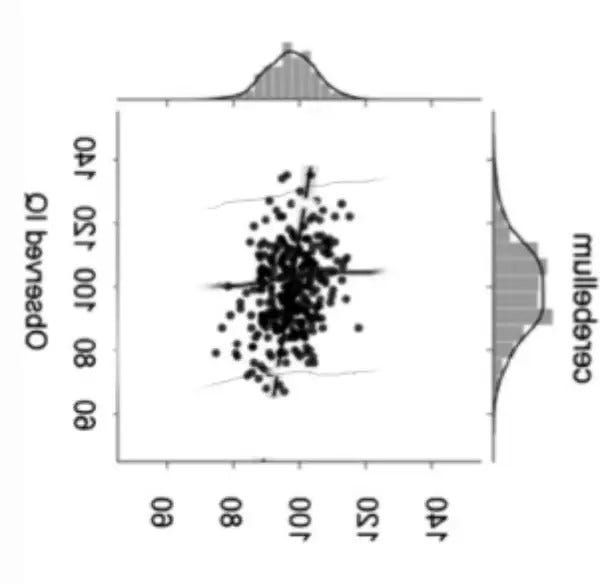
What an astounding change, just from flipping the axis. The model no longer looks impressive, or even that interesting. (If you’re really paying attention, this is the same problem found in medicine and its insistence in looking at sensitivity of tests and not predictive value, or in conflating the two. We’ll save that for another day.)
The cerebellum volume [this should be predicted IQ] goes from about 80 to 120, predicting observed scores from about 70 to 140. The ranges don’t match, which is bad for the model.
Still, there is a slight increase in the chance of greater scores given higher volumes. There is some predictive value, but not much.
The hypothesis has been confirmed, to a small, but certainly not great, degree. At least for cerebellar volume. (They have many other plots for other brain regions; they all look like this.)
Nothing to write home about, but still worth publishing, because the question was a natural one.
Have you paying attention, Anon? Then here is your homework. The authors did several models (like PCA, which they rejected). Here’s one using the limbic network on test score.
What can you say about this picture? This is from another of the author’s models which, apparently, looks much better.
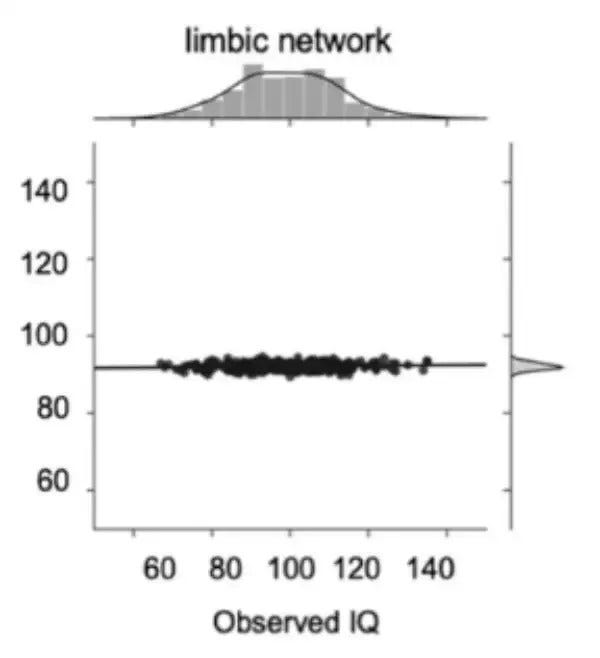
Hand in your results by Monday, 7 August for full credit.
Subscribe or donate to support this site and its wholly independent host using credit card click here. Or use the paid subscription at Substack. Cash App: $WilliamMBriggs. For Zelle, use my email: matt@wmbriggs.com, and please include yours so I know who to thank.
Hominid development and brain size correlate. Homo sapiens sapiens has a larger brain that Homo erectus. Maybe just one of those coincidences. Also, Einstein as an adult had a bigger brain than Einstein as a baby. A fluke!
I don't even understand the graph. Probably I'm stupid but I don't get it how x and y axis are the same.