Mask - Model - Medication - Mass Hysteria -- Coronavirus Update LIII
MASS HYSTERIA
There is already a paper on people going nuts: COVID-19 and the Political Economy of Mass Hysteria by Bagus et al.
Abstract (with added paragraphifications by me):
In this article, we aim to develop a political economy of mass hysteria. Using the background of COVID-19, we study past mass hysteria. Negative information which is spread through mass media repetitively can affect public health negatively in the form of nocebo effects and mass hysteria.
We argue that mass and digital media in connection with the state may have had adverse consequences during the COVID-19 crisis. The resulting collective hysteria may have contributed to policy errors by governments not in line with health recommendations.
While mass hysteria can occur in societies with a minimal state, we show that there exist certain self-corrective mechanisms and limits to the harm inflicted, such as sacrosanct private property rights. However, mass hysteria can be exacerbated and self-reinforcing when the negative information comes from an authoritative source, when the media are politicized, and social networks make the negative information omnipresent.
We conclude that the negative long-term effects of mass hysteria are exacerbated by the size of the state.
Says it all, n'est-ce pas?
MASK HYSTERIA
The CDC, now losing relevance since coronadoom deaths are dropping, decided to get on the double-mask train.
Now any idiot with no scientific training whatsoever knows that one mask restricts breathing, and that two restricts it more. Air flow is twice as impeded, or whatever. Three masks impede it more, and so on.
There is therefore no reason in the world to do a "study" to, well, study this. It is pure scientism of the first kind, if it happens.
The CDC made it happen.
"Made what happen, Briggs?"
Science, dear boy. Science.
In this episode of Science, they hooked masks to some dummies---no, not politicians---mannequins and discovered, lo, two masks blocked air flow more than one mask.
What's that got to do with how people actually wear masks in public, due to making masklessness a crime?
Not a damned thing.
They did it anyway, however, to use as a tool to browbeat you into more mass hysteria, to continuing the panic. To keeping the madness going.
The best experiment was the Danish one, which tracked how people actually use masks, even the best masks, even after being instructed in their proper use. Results?
Don't bother wearing a mask. Read all about that here.
We have a century of papers of observations, not models, showing mask use in the general public don't work. This evidence is ignored in favor of models and theory that insist masks do work.
Now I've said it more times than you can to hear, but---
"Say it again, Briggs. You know how much we like to hear it."
Well, okay. Here it is again. All models---
"Does that all mean all, Briggs?"
It do. All models, and all theories, only say what they're told to say. So that if a model is told to say two masks are better than one in theory, then that's what it'll say. It is not a finding.
It is further not a "finding" or discovery to learn more masks block more air flow.
Anyway, never mind. The Cult of the Mask is maybe even stronger than the Cult of Diversity. Your immune system is nothing. Everybody who ever caught a disease before 2019 died of it, until we learned the glory of masks.
"It's Science!"
It is.
FABULOUS FAUCI FETED
https://twitter.com/johncardillo/status/1361408125081948162
If these million reasons aren't enough to convince you of the madness of it all, then you are lost.
And it's wonder they don't love DeSantis:
https://twitter.com/SKMorefield/status/1361496746455687171
GOVERNMENT SOLUTIONS KILL
Headline: While ER visits were down last year, drug overdoses increased amid pandemic
Researchers from the Centers for Disease Control and Prevention studied more than 180 million ER visits from Dec. 30, 2018, to Oct. 10, 2020, and found that weekly counts of all drug overdoses were up to 45% higher in 2020 than in 2019, according to the study published Feb. 3 in the peer-reviewed JAMA Psychiatry. Opioid overdoses, specifically, increased about 29% compared with before the pandemic.
Government "solutions" caused these deaths.
The study didn't say "solutions", they just said the bug. But there is no causal connection between the bug and suicide. There is, though, a direct connection in government calling you inessential.
Keep this in mind when you see the all-cause and "excess" death numbers. The "excess" deaths are NOT all coronadoom deaths. They include solution-deaths, too.
Madness.
MODEL MADNESS
All computer models -- every damned one of them: no exceptions -- only say what they are told to say.
https://twitter.com/itvnews/status/1361418477861367809
My wish is that people remember that if they remember nothing else.
BOOK
https://twitter.com/TomDNaughton/status/1358941274686980098
Website of similar name: price of panic.
THE NUMBERS
Sources: daily tests, CDC official toll number one, number two (the old weekly file, now suspect). Deaths by age. Covid & flu. WHO flu tracker. All current as of Monday night.
Daily tests:
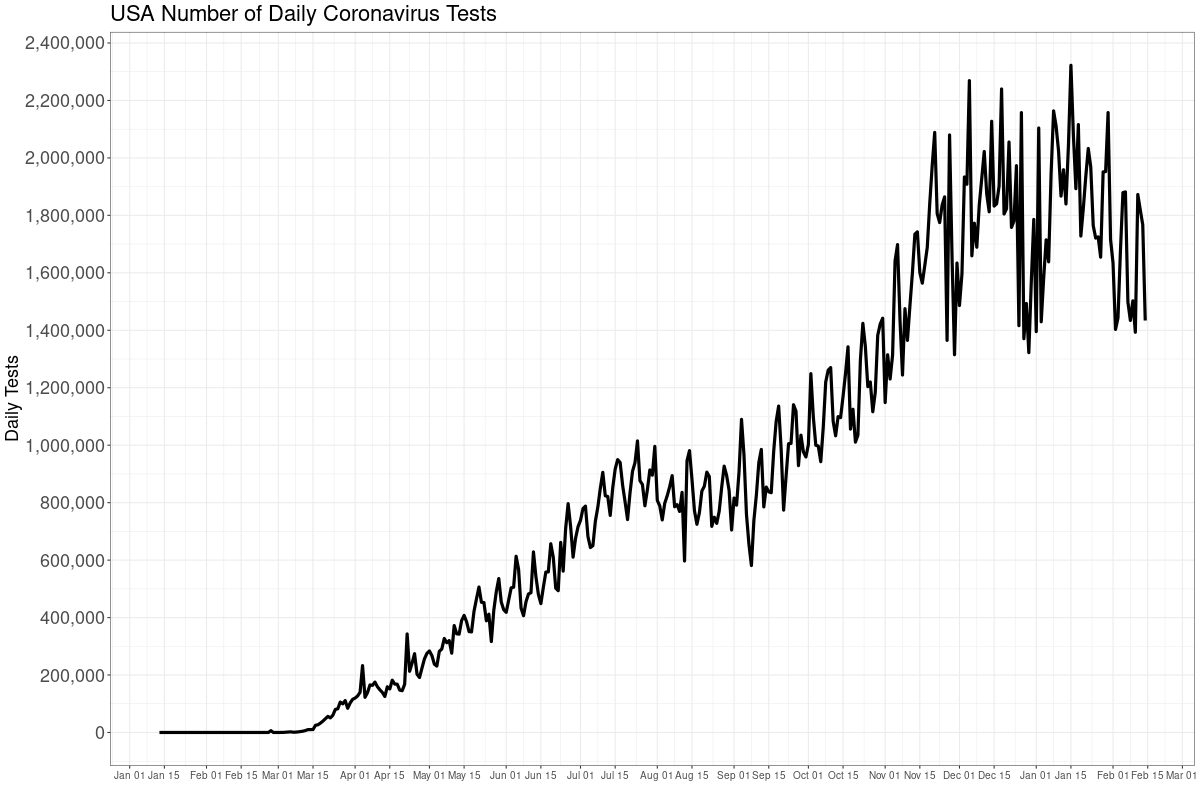
Testing still on the way down, which is good.
Every positive test the media falsely calls a "case", when it is only an infection with varying degrees of seriousness---and most are not serious. The media really does not know how to tell the truth.
Positivity rate of the tests. You'll recall three weeks ago we discussed how the WHO told people to lower the PCR Ct rates, which should produce fewer positives---and fewer false positives.
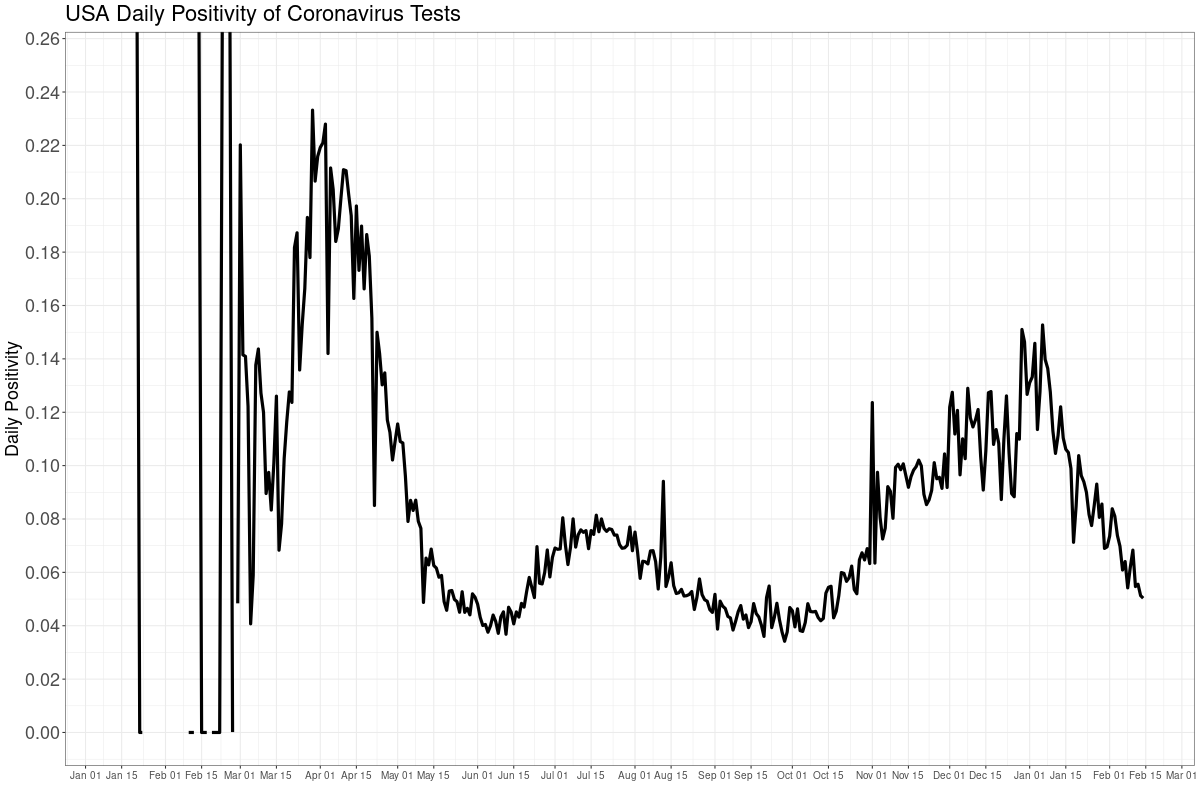
Notice carefully this chart has nothing to do with the number of tests. Positivity wouldn't, per se, fall because testing fell.
Something else, not testing, is making this disease fade into the background---there, to join all the other ones which have plagued us since Eve first said, "Equality!"
Fewer official positive tests mean, necessarily, fewer attributed coronadoom deaths, and also fewer "cases" (infections).
What is causing this? The lowered Ct is certainly part of this. Also the weather. Deaths of all diseases always drop starting the end of January. The vaccines, even though not widely administered, likely accounts for some of the drop, too.
CDC weekly ALL CAUSE death counts, or the Perspective Plot, from late 2009 until now. The late drop off is late counting: it takes up to eight weeks to get all data. We need to look at all cause deaths because we can't quite trust the attributed COVID numbers.
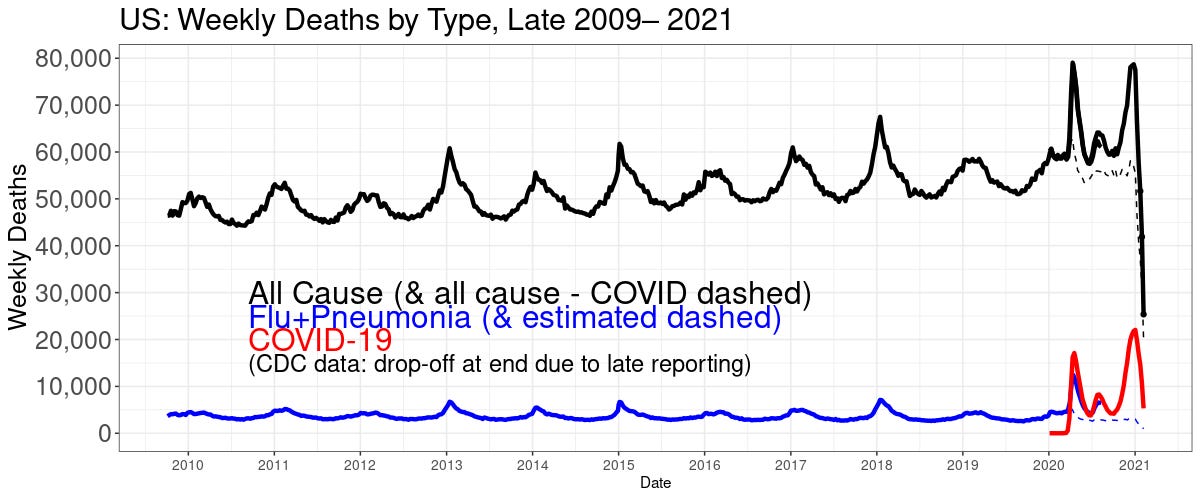
The black line is deaths of any kind. The red is COVID. The blue line is flu+pneumonia (it's the pneumonia that kills most flu patients). The blue is estimated starting mid year 2020 because CDC stopped separate reporting on flu. The suspicion is some flu and pneumonia deaths are being attributed to COVID.
The early 2020 all-cause peak was larger than the late peak, but the early coronadoom peak was smaller than the latter. Makes one wonder how many over-attributions there are.
DEATHS ALWAYS PEAK IN MID JANUARY, THEN DROP. EVEN WITHOUT GOVERNMENT INTERVENTION. PLEASE PASS THIS INFORMATION ON!
The January peaks are caused when we enter our voluntary lockdowns in winter, spreading bugs. This is also the "solution" governments hit upon to stop the spread of bugs. Lockdowns kill.
Here is the CDC deaths "involving" COVID.
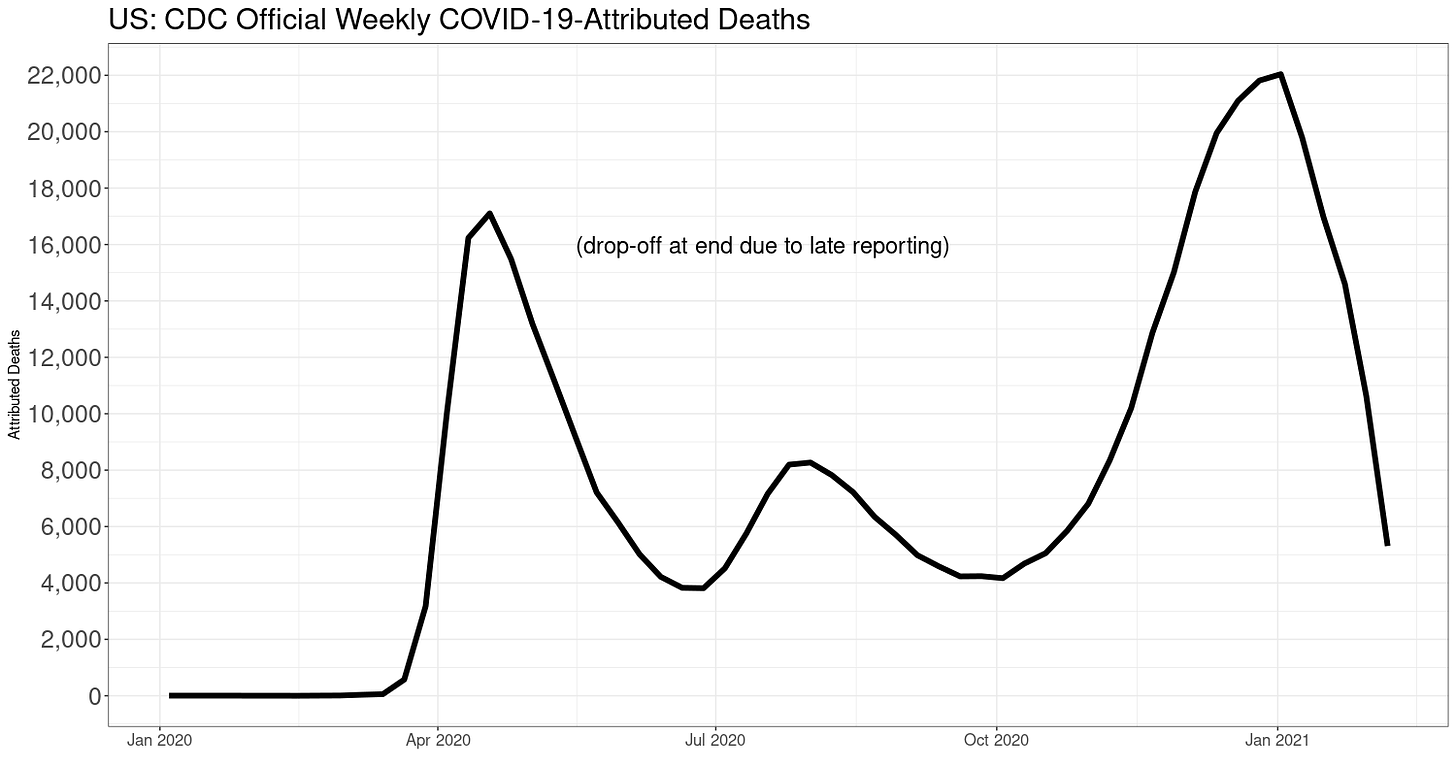
Even with late counting it's clear attributed deaths are on their way down---as non-experts have been predicting.
Here is another way to look at all deaths, the week-of-the-year all-cause deaths.
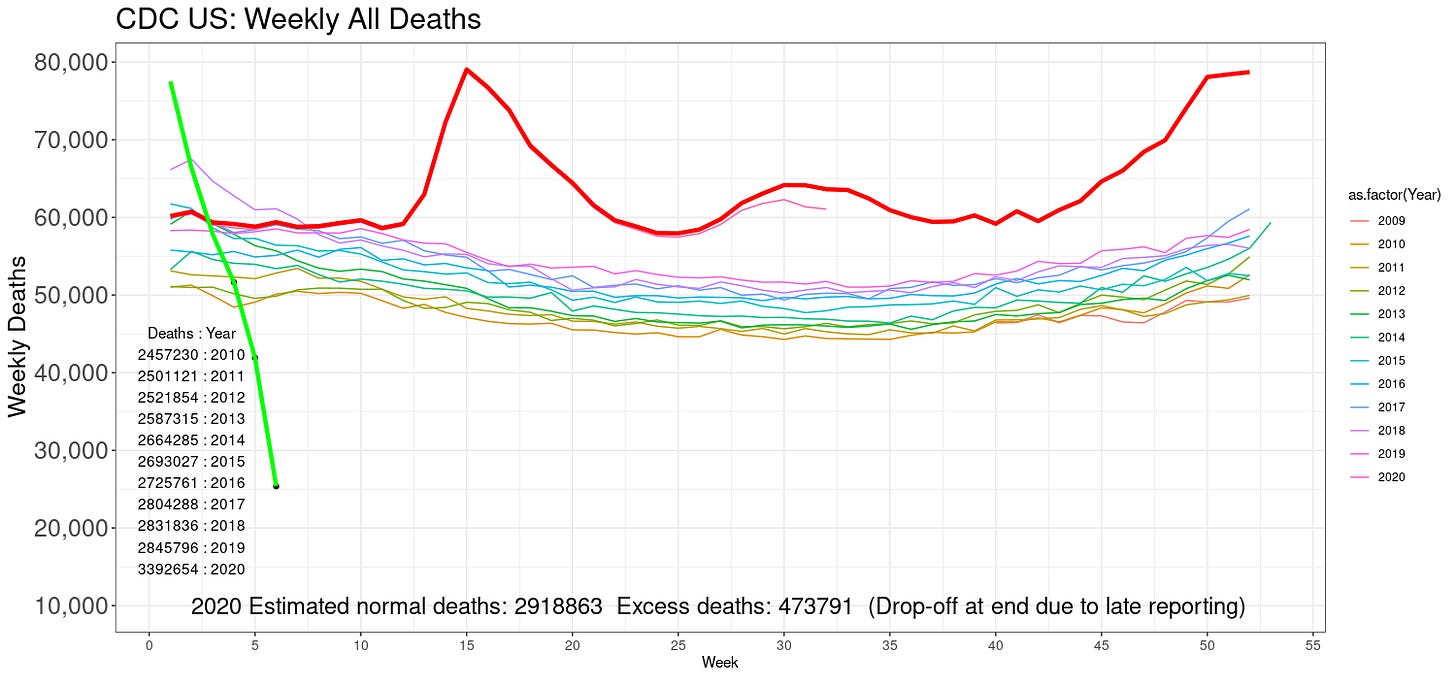
The 2020 estimated "excess" deaths (using my extrapolation model) are closing in. About 475 thousand. This will rise a bit with late counts. Rose about 12,000 since last week, and slowing.
MOST IMPORTANT: these are not all COVID deaths! They include deaths from the "solution" to COVID, too. Plus increased suicides, septicemia and other iatrogenic kills, cancers, heart attacks, and everything else due to lockdowns. Like car crashes, as we saw above. Plus, there were over 80,000 drug overdose deaths last year. This point cannot be over-emphasized.
The green line at the left are 2021 numbers; obvious under-counts for the last three weeks.
Flu is still missing. Here is the WHO's global flu tracker, which still shows flu has gone missing everywhere:
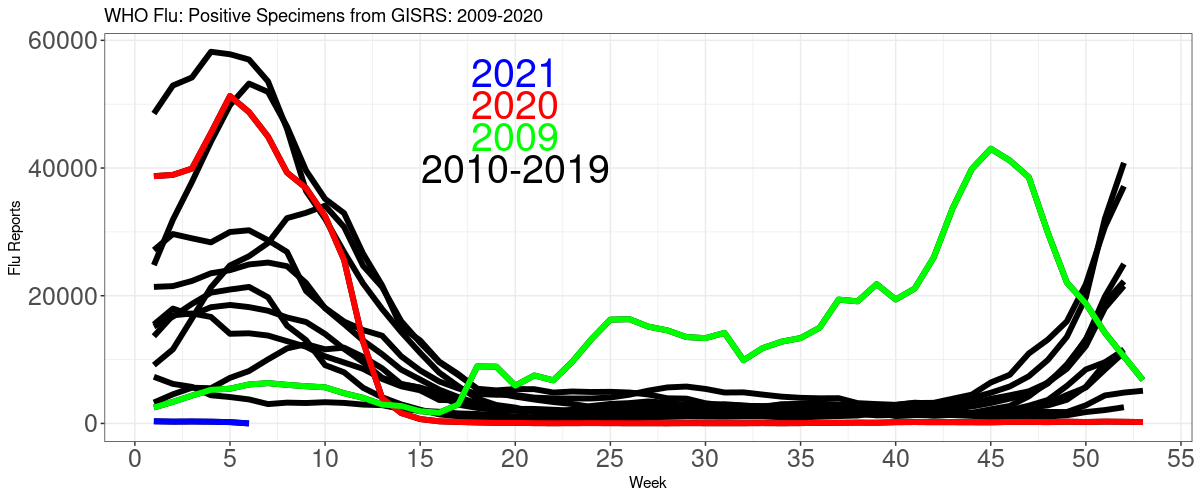
Flu is still gone the whole world over.
Here is the CDC official population mortality rates for the all causes other than COVID, and "involving" COVID (with and of; "involving" is CDC's word).
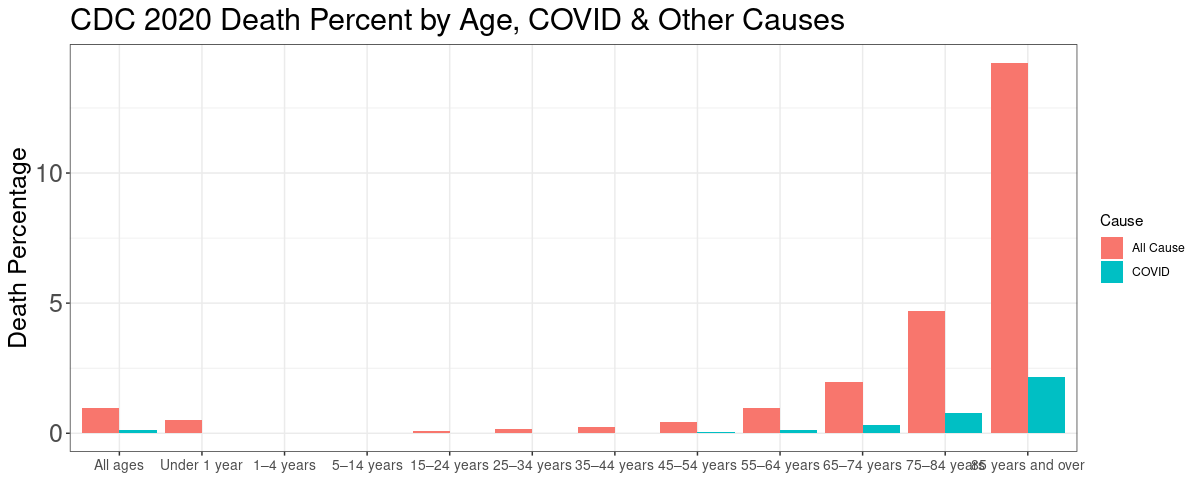
Here are the same population fatality rates in tabular form:
POPULATION FATALITY RATES
                 Age     COVID OtherCause
1       Under 1 year 0.0000120    0.00510
2          1–4 years 0.0000015    0.00022
3         5–14 years 0.0000017    0.00014
4        15–24 years 0.0000150    0.00085
5        25–34 years 0.0000610    0.00160
6        35–44 years 0.0001800    0.00240
7        45–54 years 0.0005000    0.00440
8        55–64 years 0.0012000    0.00970
9        65–74 years 0.0030000    0.02000
10       75–84 years 0.0077000    0.04700
11 85 years and over 0.0210000    0.14000
I say this every week, yet I don't believe it is much heard: No matter what age, there is at least about a 10 times or larger chance of dying from something else then COVID. If you're under 44, the COVID risk is tiny. Our level of fear is in not in line with the actual risk for the majority of the population.
About masks in depth, see this article and this one. I am also working on a comprehensive article about masks. Hint: they do not work.
To support this site and its wholly independent host using credit card or PayPal (in any amount) click here


