Infections Drop! Experts Baffled! -- Coronavirus Update LII
EXPERTOLOGY
The Daily Mail headline is that "experts" were "baffled" that coronadoom "cases", by which they mean infections, fell by 50%, and that (in another headlines) they were "plummeting".
One of the headlines, like many in the media, pointed to the "highest death day evah!" It wasn't. That was back on 15 April when over 6,000 doom deaths were reported. Since day one I warned us that reporting and reality don't match up, not in medical data. Check for yourself and you'll see last week's "highest death day evah!" was obvious a reporting trick.
The media is the enemy of the people.
Incidentally, it's worth your time to enter "experts baffled covid" (or coronavirus) into search engines, focusing on news. Many headlines going back to last March. A lot of expert bafflement! But no shortage of confidence that quarantining the healthy and sick together, and that masking masklessness a federal crime are terrific ideas.
Anyway, regular readers will know that since early December (maybe before? I lost count) we have been making one of the easiest predictions that can be made: that deaths would peak in mid-January or so, and would then begin to fall. Because this happens every single year without exception and for the same reasons: voluntary lockdowns due to the cold weather.
We all start heading in late fall, the bugs circulate, and the bodies start piling up in December, with the peak, again, in early January. By the end of January, the most susceptible die off, and the rates go down.
Deaths of all kinds.
Meaning a guy who had a cardiac and keeled over after New Years died in fact of an MI. But that he also got a bad cold, or flu, or bronchitis, or whatever, pushed him over the edge.
Only this year, if the man got the doom, instead of putting heart attack on the death certificate, they'd instead put the coronadoom.
https://twitter.com/disclosetv/status/1357061387999014912
The drop can't be vaccines, not yet, not fully. It can't be the lowering of Ct---the Biden effect---resulting in lower recorded infections, thus lower recorded hospitalizations and deaths, not fully.
But it can be mostly the weather. As it always is.
Speaking of cowardly experts, this:
https://twitter.com/FamedCelebrity/status/1358883914954117122
For when this tweet dies of coronavirus in 7 days, it reads, "Calm yourselves, cowardly experts. The flu, the common cold, syphilis, ebola, many, many others, including the most deadly of all, rabies, will always be with us. The coronadoom is just one more" with a link to cowardly experts WSJ piece.
EXCESS DEATHS
From reader BD comes this bit of hilarity: Risky driving: US traffic deaths up despite virus lockdowns.
The number of people killed on the nation’s highways rose 4.6% in the first nine months of 2020 despite coronavirus lockdowns that curtailed driving early in the year.
The National Highway Traffic Safety Administration estimates that 28,190 people died in traffic crashes from January through September of last year, up from 26,941 in the same period of 2019. Final statistics for the full year won’t come out until fall.
Authorities blamed the increase on risky driving behavior that developed when there were few vehicles on the road early in the pandemic.
“Preliminary data tells us that during the national health emergency, fewer Americans drove, but those who did took more risks and had more fatal crashes,” the safety agency said in a letter addressed to the nation’s drivers.
More deaths caused by government "solutions".
CULT OF THE MASK
Or, an old man becomes an old woman.
https://twitter.com/DanRather/status/1358574383489425408
BOOK
https://twitter.com/itsdesign/status/1356338321769697280
Website of similar name: price of panic.
THE NUMBERS
Sources: daily tests, CDC official toll number one, number two (the old weekly file, now suspect). Deaths by age. Covid & flu. WHO flu tracker. All current as of Monday night.
Our interest this week is the expert bafflement. How could "cases" be dropping when experts predicted otherwise?
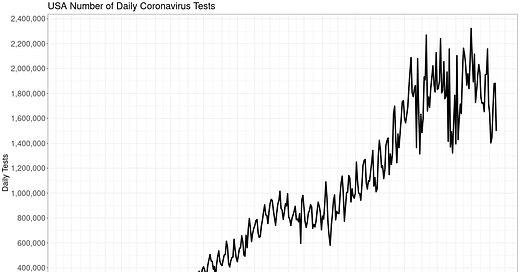
Here are the daily tests:
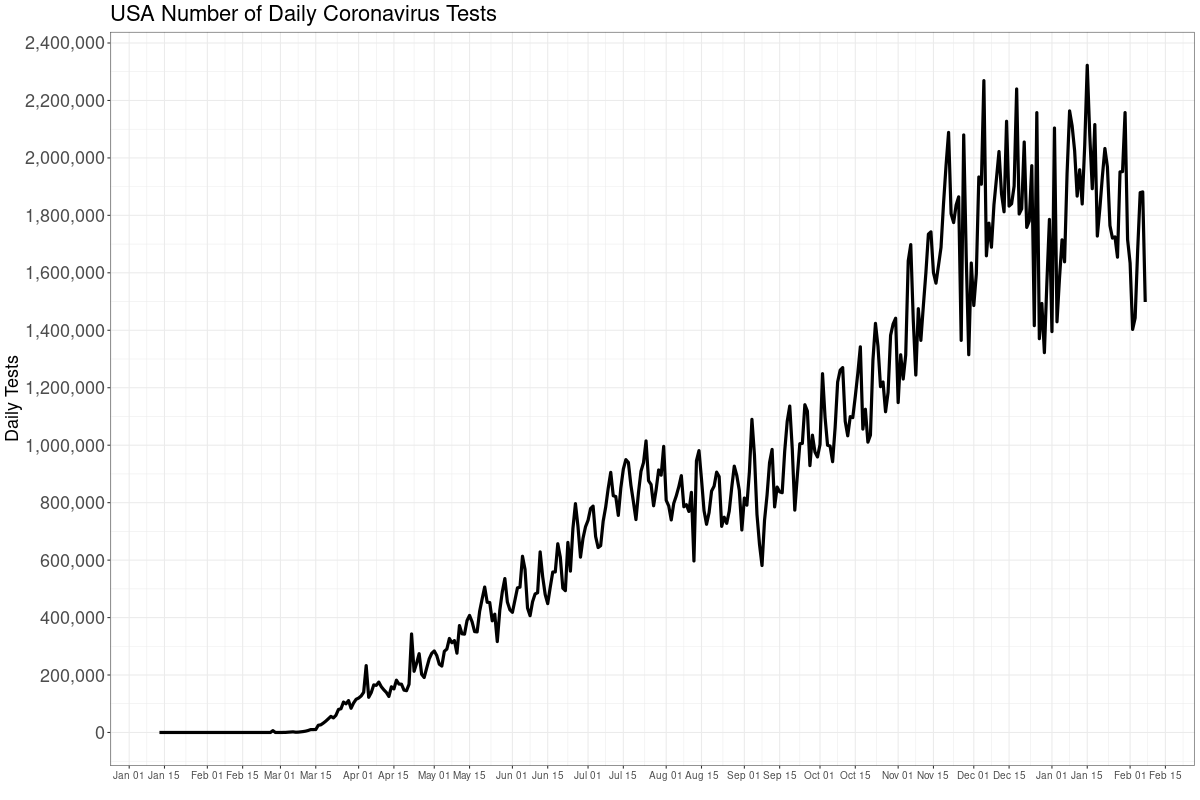
Testing on the way down, which certainly means a lessening of the panic. We're still in the thick of it, though, and won't be out until we fall to (rough guess) fewer than 200,000 a day.
Every positive test the media falsely calls a "case", when it is only an infection with varying degrees of seriousness---and most are not serious. The media really does not know how to tell the truth.
As with last week, here's even better news, the positivity rate of the tests. You'll recall two weeks ago we discussed how the WHO told people to lower the PCR Ct rates, which should produce fewer positives---and fewer false positives.
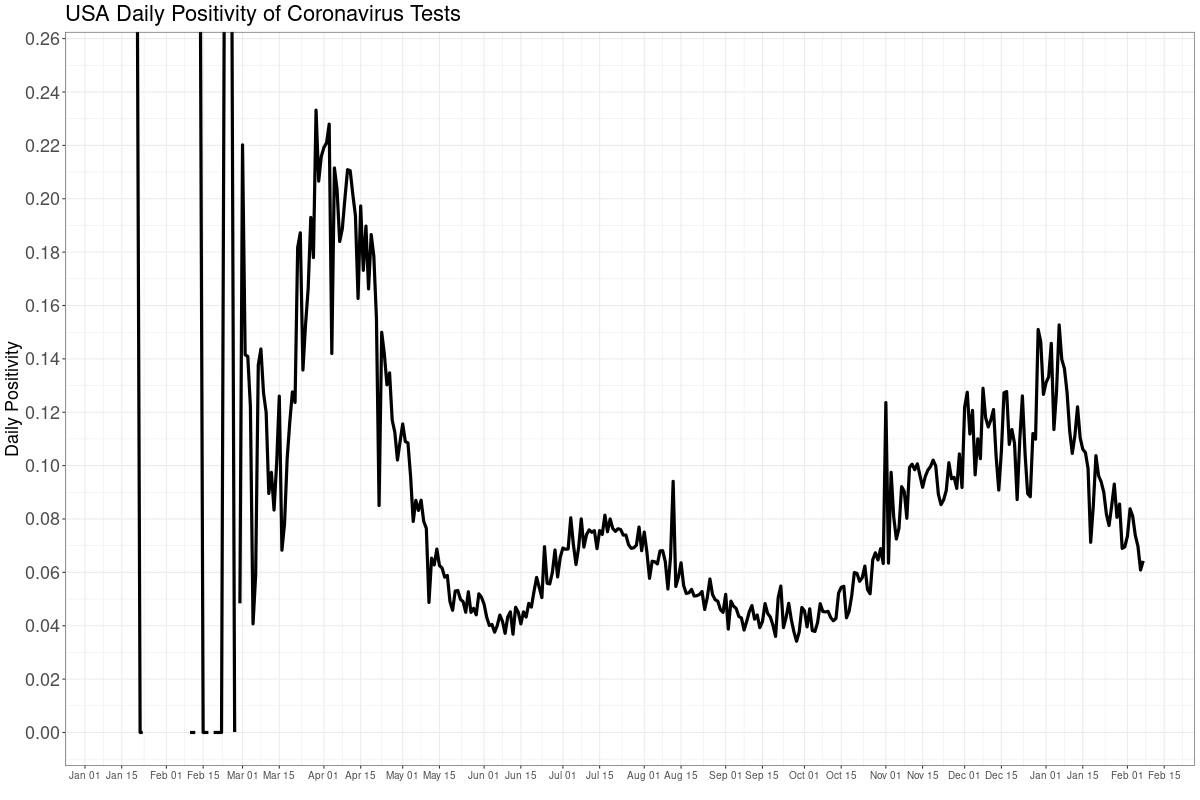
Notice carefully this chart has nothing to do with the number of tests. Positivity wouldn't, per se, fall because testing fell.
Meaning some thing, or things, are making this disease fade into the background---there, to join all the other ones which have plagued us since Eve first said, "Equality!"
Fewer official positive tests mean, necessarily, fewer attributed coronadoom deaths, and also fewer "cases" (infections).
What is causing this? The lowered Ct is certainly part of this. But also the weather, as you'll see next. Deaths of all diseases always drop starting the end of January. The vaccines, even though not widely administered, likely accounts for some of the drop, too.
CDC weekly ALL CAUSE death counts, or the Perspective Plot, from late 2009 until now. The late drop off is late counting: it takes up to eight weeks to get all data. We need to look at all cause deaths because we can't quite trust the attributed COVID numbers.
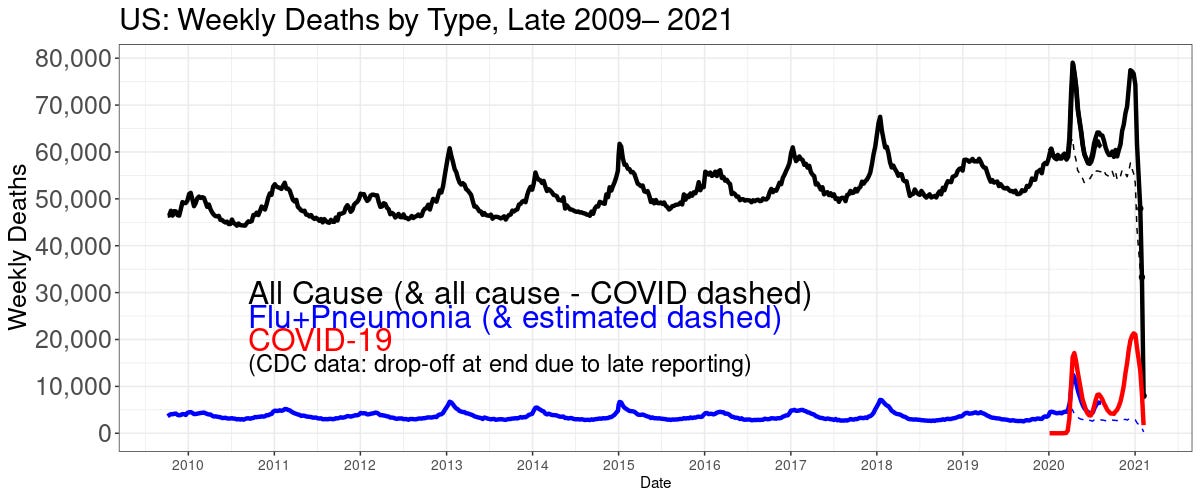
The black line is deaths of any kind. The red is COVID. The blue line is flu+pneumonia (it's the pneumonia that kills most flu patients). The blue is estimated starting mid year 2020 because CDC stopped separate reporting on flu. The suspicion is some flu and pneumonia deaths are being attributed to COVID.
You can see the initial peak in 2020, when the virus first hit in the northeast, and then a smaller bump when it spread south and west. The January bump now is in line with what we expected.
And, as expected, and what baffled the experts, is deaths begin to drop in February.
DEATHS ALWAYS PEAK IN MID JANUARY, THEN DROP. EVEN WITHOUT GOVERNMENT INTERVENTION. PLEASE PASS THIS INFORMATION ON!
The January peaks are caused when we enter our voluntary lockdowns in winter, spreading bugs. This is also the "solution" governments hit upon to stop the spread of bugs. Lockdowns kill.
Here is the CDC deaths "involving" COVID.
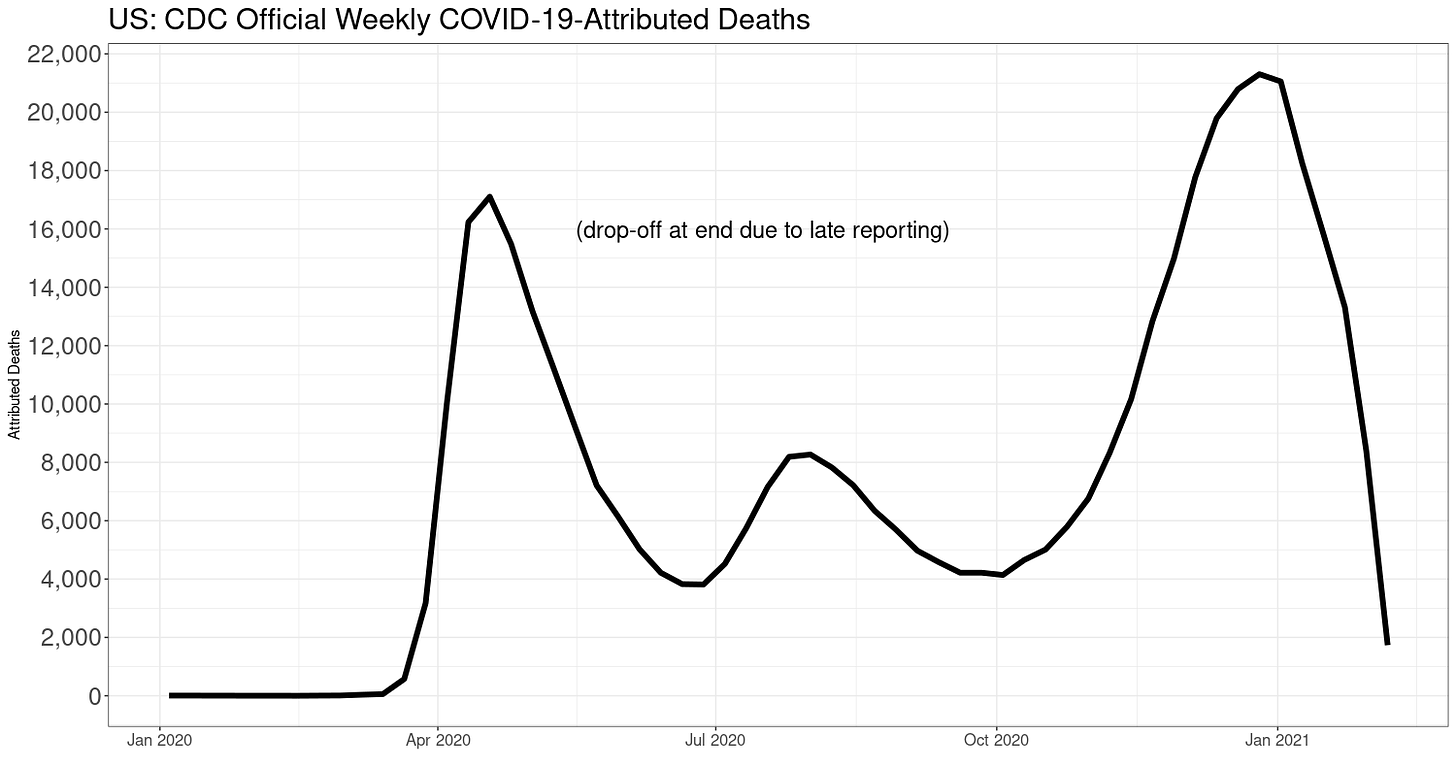
Even with late counting it's clear attributed deaths are on their way down---as non-experts have been predicting.
There is also concern some of these attributed deaths are flu or pneumonia and not COVID per se.
Here is another way to look at all deaths, the week-of-the-year all-cause deaths.
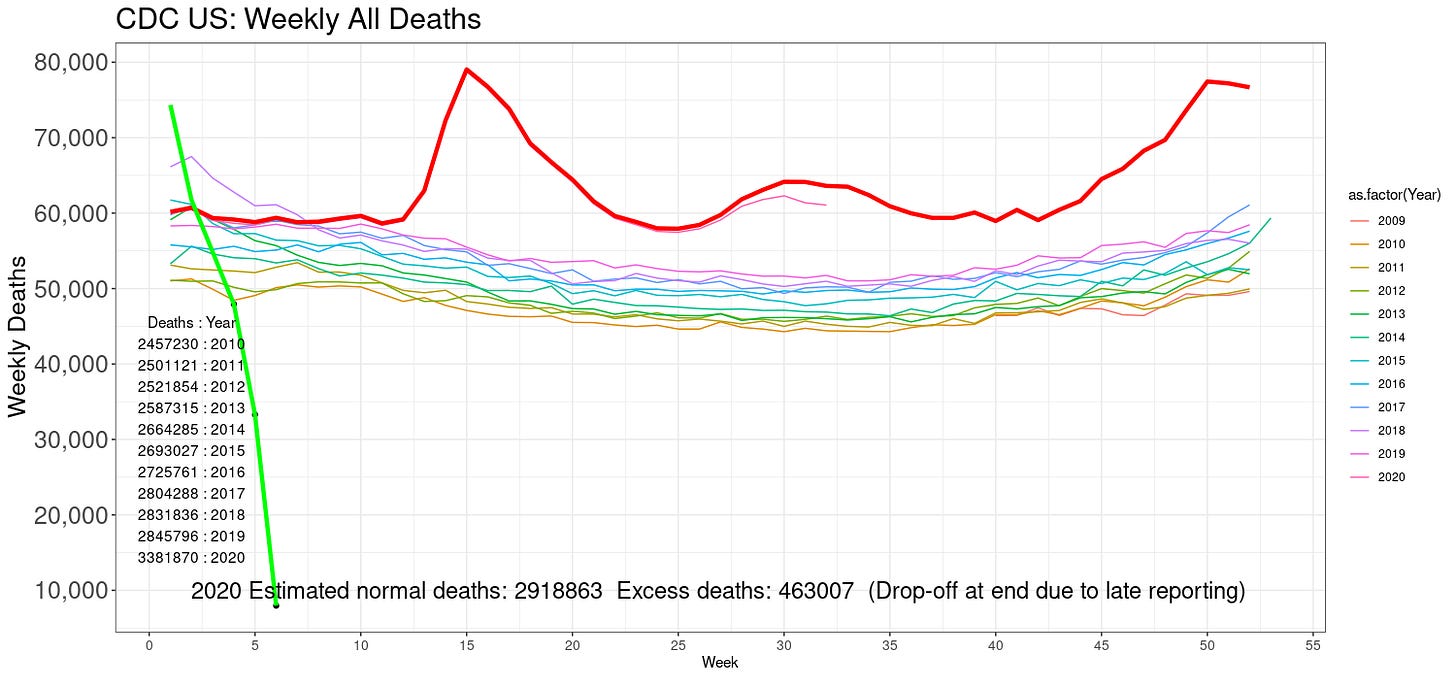
The 2020 estimated "excess" deaths (using my extrapolation model) are closing in. About 460 thousand. This will rise a bit with late counts. Not as much as last week, I think.
IMPORTANT: these are not all COVID deaths! They include deaths from the "solution" to COVID, too. Plus increased suicides, septicemia and other iatrogenic kills, cancers, heart attacks, and everything else due to lockdowns. Like car crashes, as we saw above. Plus, there were over 80,000 drug overdose deaths last year.
The green line at the left are 2021 numbers; obvious under-counts for the last three weeks.
Flu is still missing! CDC found one pediatric death for flu this season. One! Here is the WHO's global flu tracker, which still shows flu has gone missing everywhere:
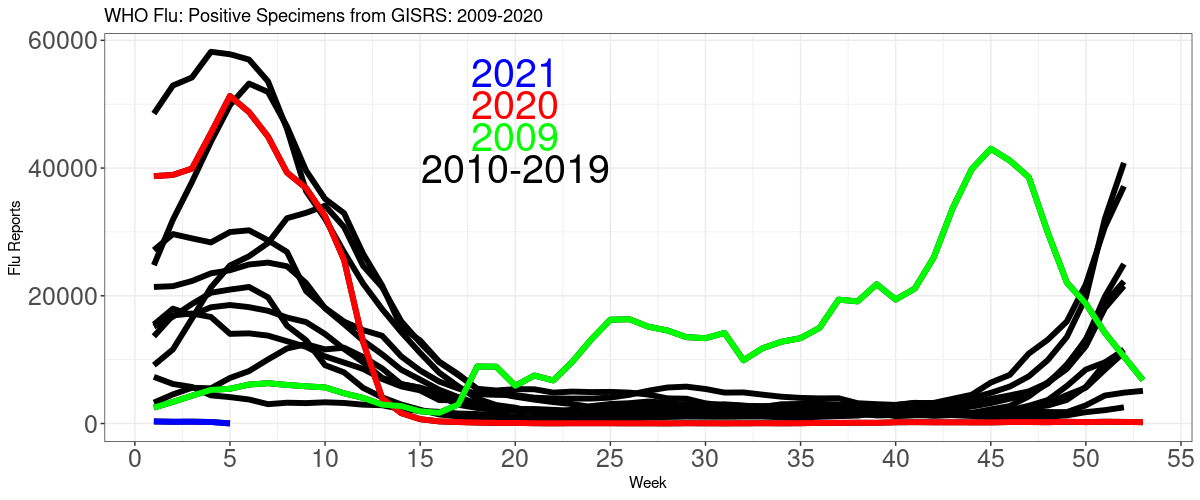
Flu is still gone the whole world over. Leading us to suspect some COVID deaths are really flu+pneumonia.
Here is the CDC official population mortality rates for the all causes other than COVID, and "involving" COVID (with and of; "involving" is CDC's word).
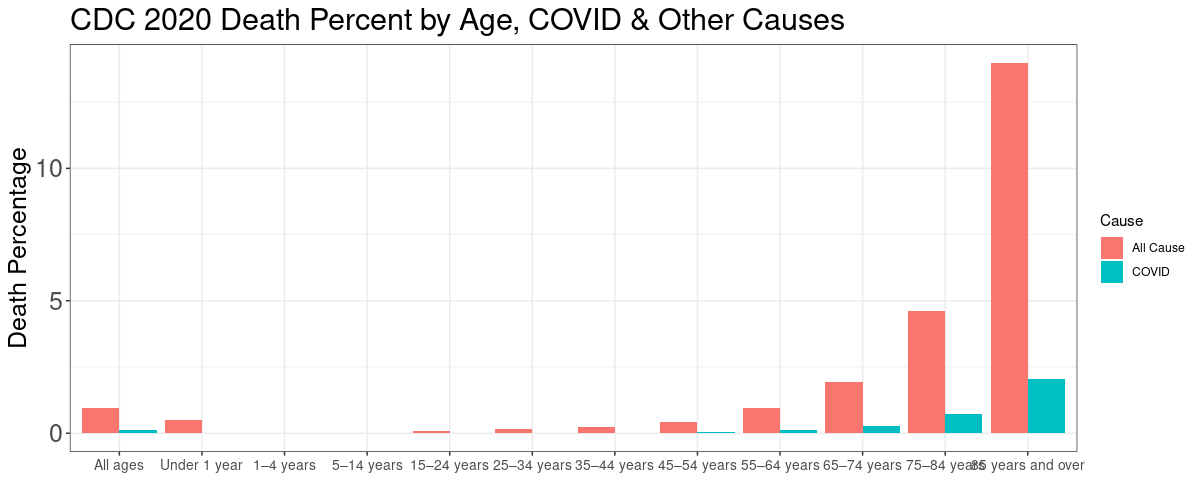
Here are the same population fatality rates in tabular form:
POPULATION FATALITY RATES
                 Age     COVID OtherCause
1       Under 1 year 0.0000120    0.00500
2          1–4 years 0.0000015    0.00022
3         5–14 years 0.0000016    0.00014
4        15–24 years 0.0000140    0.00083
5        25–34 years 0.0000580    0.00160
6        35–44 years 0.0001700    0.00240
7        45–54 years 0.0004800    0.00430
8        55–64 years 0.0012000    0.00950
9        65–74 years 0.0029000    0.01900
10       75–84 years 0.0073000    0.04600
11 85 years and over 0.0200000    0.14000
No matter what age, there is at least about a 10 times or larger chance of dying from something else then COVID. If you're under 44, the COVID risk is tiny. Our level of fear is in not in line with the actual risk for the majority of the population.
About masks in depth, see this article and this one. I am also working on a comprehensive article about masks. Hint: they do not work.
To support this site and its wholly independent host using credit card or PayPal (in any amount) click here

