Cuomo, Whitmer, Newsom Are Worse Than Wrong: Coronavirus Update XLIV
OPEN TYRANNY
The Godmother closed restaurants again. Not because of any new evidence. Not because of any evidence at all. Because he could. Because there's nothing you can, or will, do about it. Obey.
One reporter on the story, bless him, said "The state's own data at Friday's press conference revealed that indoor dining accounted for a scant 1.4?percent of infection spread-- which might be less risky than crossing the street."
Evidence from Day One was that lockdowns killed, lockdowns destroyed. We'll below that our annual voluntary lockdowns account for the winter peak in deaths. Evidence never mattered to Cuomo, or to the other tyrants. Evidence can never matter when confronting The Science.
On the same day the Godmother dictated the closing of restaurants, he announced this:

Restaurants for me, but not for thee. Whatcha gonna do about it.
Nothing. You are still allowed by law to seethe. Enjoy that while you can. Tyrants hate disagreement above all things. When they are fully in charge, they will remove the seething loophole.
It was your fear, your panic that caused this.
It was your quacking that emboldened tyrants like Gretchen Whitmer, Gavin Newsom, Angela Merkel (who also just canceled Christmas), and all the other progressive Governors and rulers.
Who (besides regular readers, who follow these matters) guessed tyranny would be so easy? All governments had to say was "Stay inside, close your business", and there was no recourse, no way to disobey.
Your fear taught them a valuable lesson. They will not forget it.
https://twitter.com/ChefGruel/status/1338177618298818561
Oligarchs never lock down.
OF NO COLOR
This is flu, and we'll do the COVID vaccine more later. For now, this asinine headline, from a university determined to embarrass itself: Cornell offers 'person of color' exemption for flu vaccine requirement.
Persons of no color will still have to follow orders and obey.
BOOK UPDATE
The book is still sold out! The Price of Panic.
E-book and audio book versions are still available. New books will be in stock in about a week.
https://twitter.com/EricClaghorn/status/1338024765802434560
Website of similar name: price of panic.
THE NUMBERS
Sources: daily tests, CDC official toll number one, number two (the old weekly file, now suspect). Deaths by age. Covid & flu. WHO flu tracker. All current as of Monday night.
Daily tests:
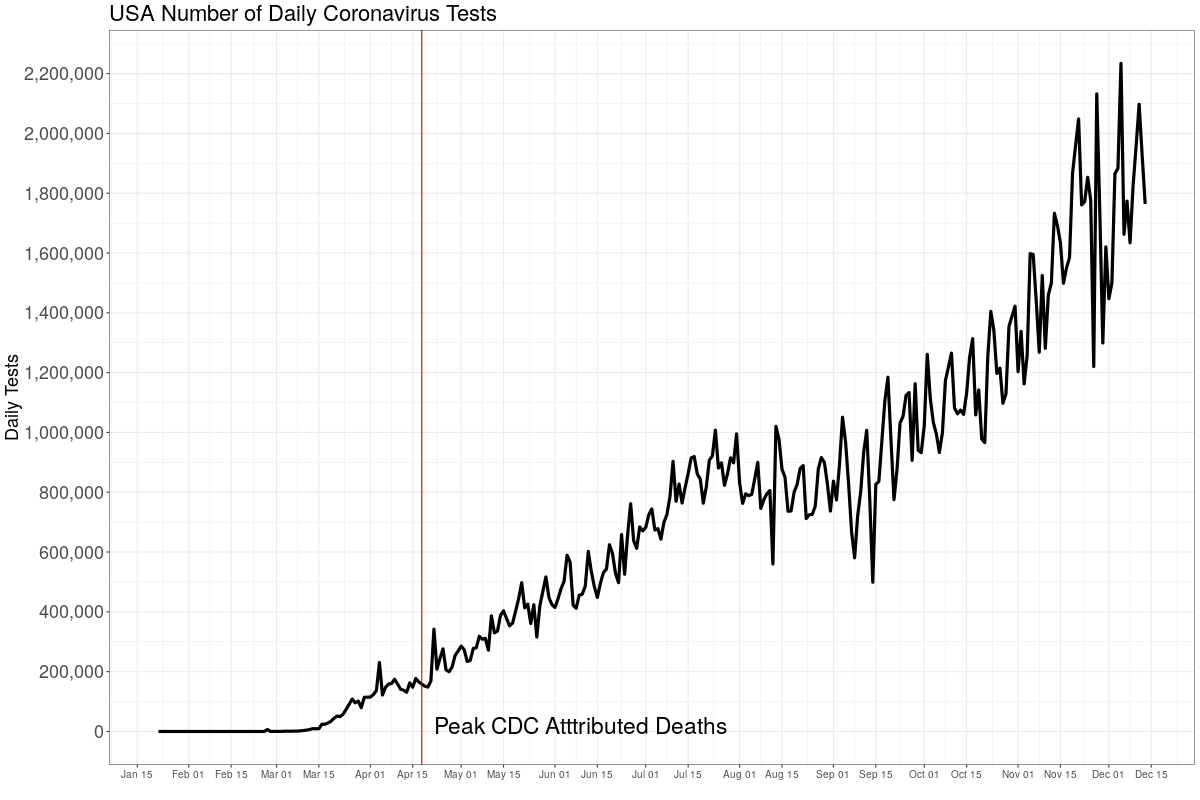
This is the number of daily tests. The date of the CDC's peak attributed deaths is noted. This is to show testing has little to nothing to do with outcomes.
We seem to have settled on a level about 2 million tests a day. We've in the middle of Panic 2.0, which is causing more tests but also frightening people away from hospitals. Balance achieved!
Each positive test in the media is counted as a new "case". These are almost all not cases, but merely positive tests, which indicate past infections, current by mild infections, asymptomatic infections, and even no infections at all. False positives.
Here are CDC the weekly attributed coronavirus deaths:
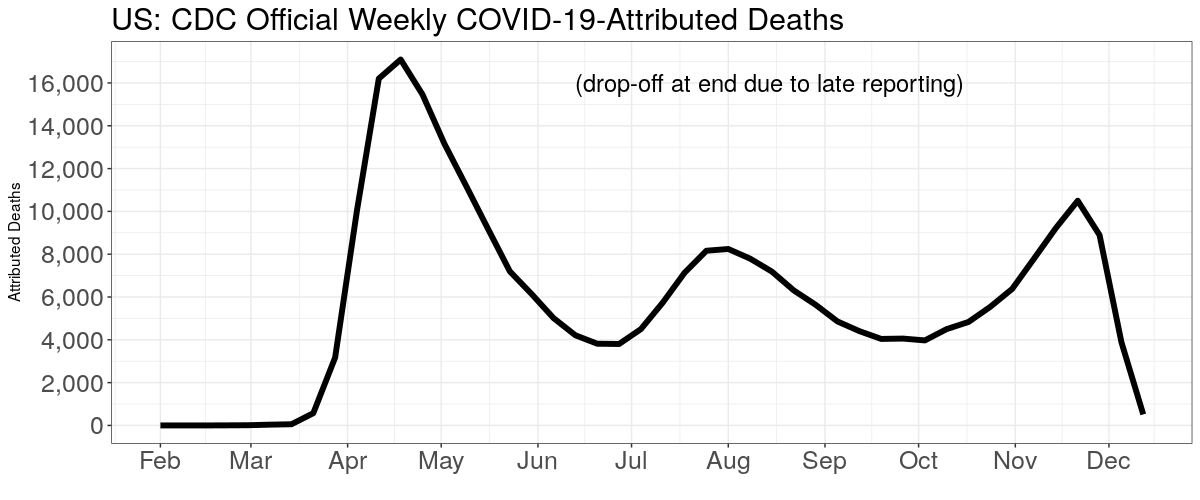
These are attributed deaths, which include all those dying with or dying from the coronavirus. The CDC says deaths "involving" COVID.
Attributed COVID deaths peaked early in the year, and then as it spread to the south, it re-peaked. It is now joining the great chorus of bugs that circulate every winter.
Be ready for this! It will peak again in winter, and subside again in spring. This year's totals will be higher than next year's, and there always be fluctuation, just like with flu.
Here's the CDC weekly ALL CAUSE death counts, or the Perspective Plot. The late drop off is late counting, which takes up to eight weeks to get all, but most are in by three. We need to look at all cause deaths because we can't quite trust the COVID numbers.
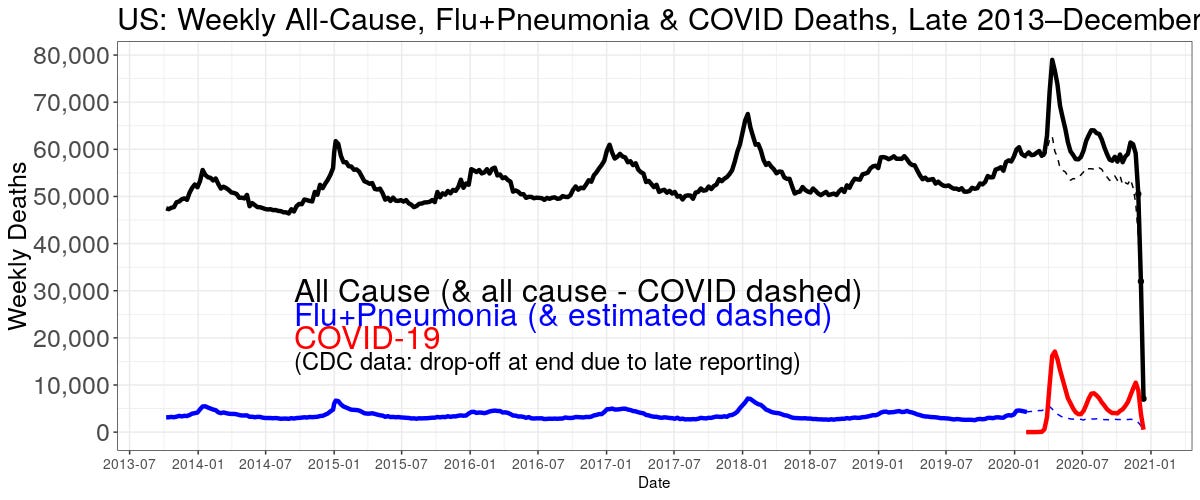
The black line is all deaths, including COVID. The dashed is all deaths minus attributed COVID, and the red, for perspective, is COVID. (Again, the drop off is late counts.) The blue line, about the same order as the doom, is flu+pneumonia (it's the pneumonia that kills most flu patients).
IT IS EXTREMELY IMPORTANT TO UNDERSTAND DEATHS ALWAYS INCREASE RIGHT AT THIS TIME OF YEAR, PEAKING IN JANUARY. DO NOT BE ALARMED. PLEASE PASS THIS INFORMATION ON!
Do you see the January peak every year? It is caused when we enter our voluntary lockdowns in winter, spreading bugs. This is also the "solution" governments hit upon to stop the spread of bugs. Lockdowns kill.
The CDC (important!) stopped reporting separate flu and pneumonia deaths midway through 2020, but I estimate them after by subtracting deaths "involving" COVID from those "involving" (their word) pneumonia or flu or COVID. That's the dashed blue line.
This is finally be noticed, even by people on the left:
https://twitter.com/sallyKP/status/1338541706816475136
Here is another way to look at the same data, week of the year all cause deaths, along with a model (black line) of what deaths would look like without COVID.
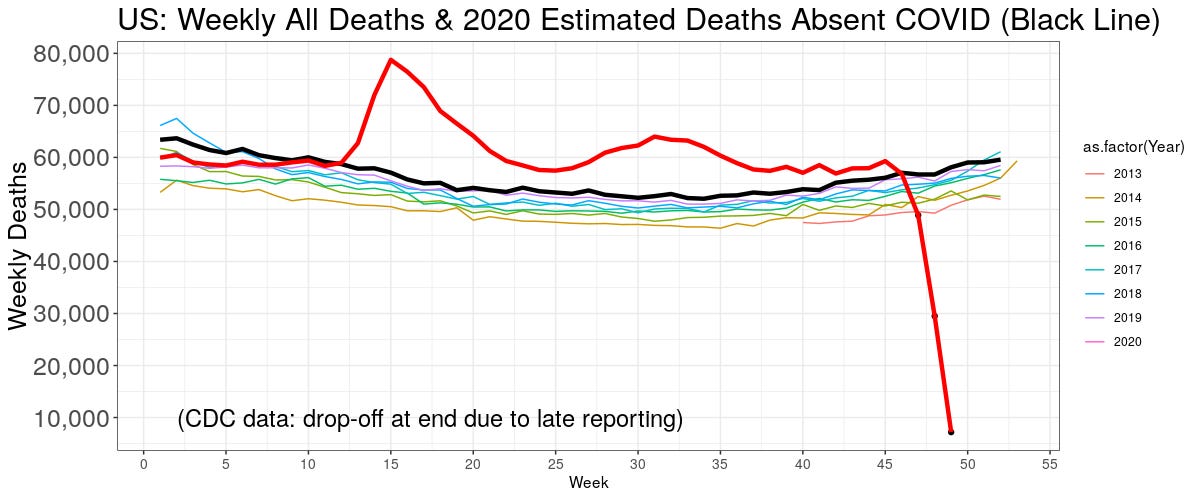
CDC has their own "excess" death model with which I do not agree. I've explained that in other posts; briefly, the black line is my model, based only on extrapolating population increase. That allows us to produce this figure, which is the cumulative estimate of the 2020 total "excess" deaths.
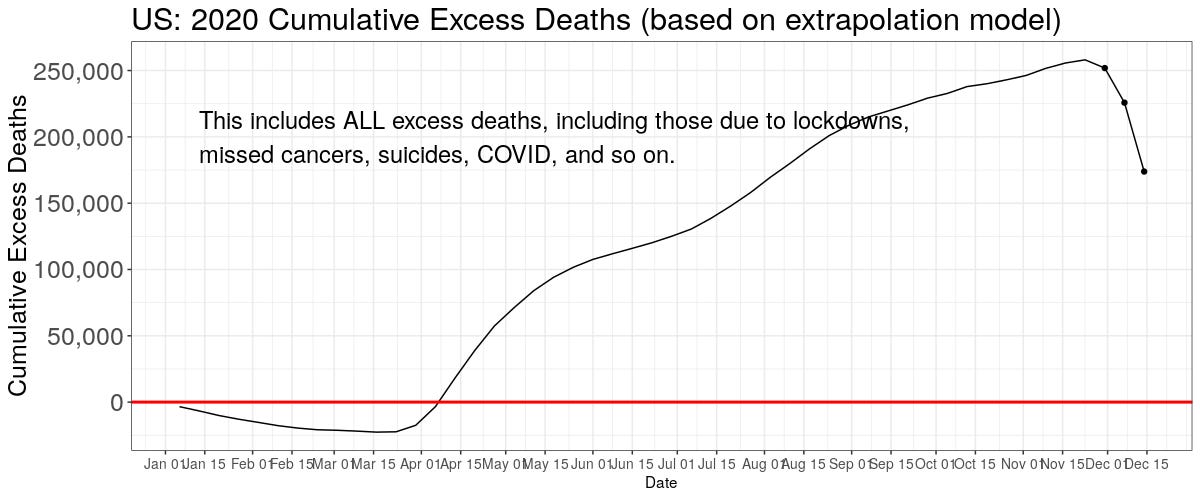
Ignore the last three points or so, which are due to late counts. We're at about 250,000 excess deaths for the year. Which is about the proportionally as we saw in the '57-'58 Asian flu.
Understand: these "excess" are not just COVID, but all the deaths caused by the "solution" to COVID, caused by the lockdowns, missed diagnoses, suicides, iatrogenic deaths, and on and on. Panic kills.
CDC says "Flu activity is unusually low at this time but may increase in the coming months." They only found one pediatric death for flu this year. One.
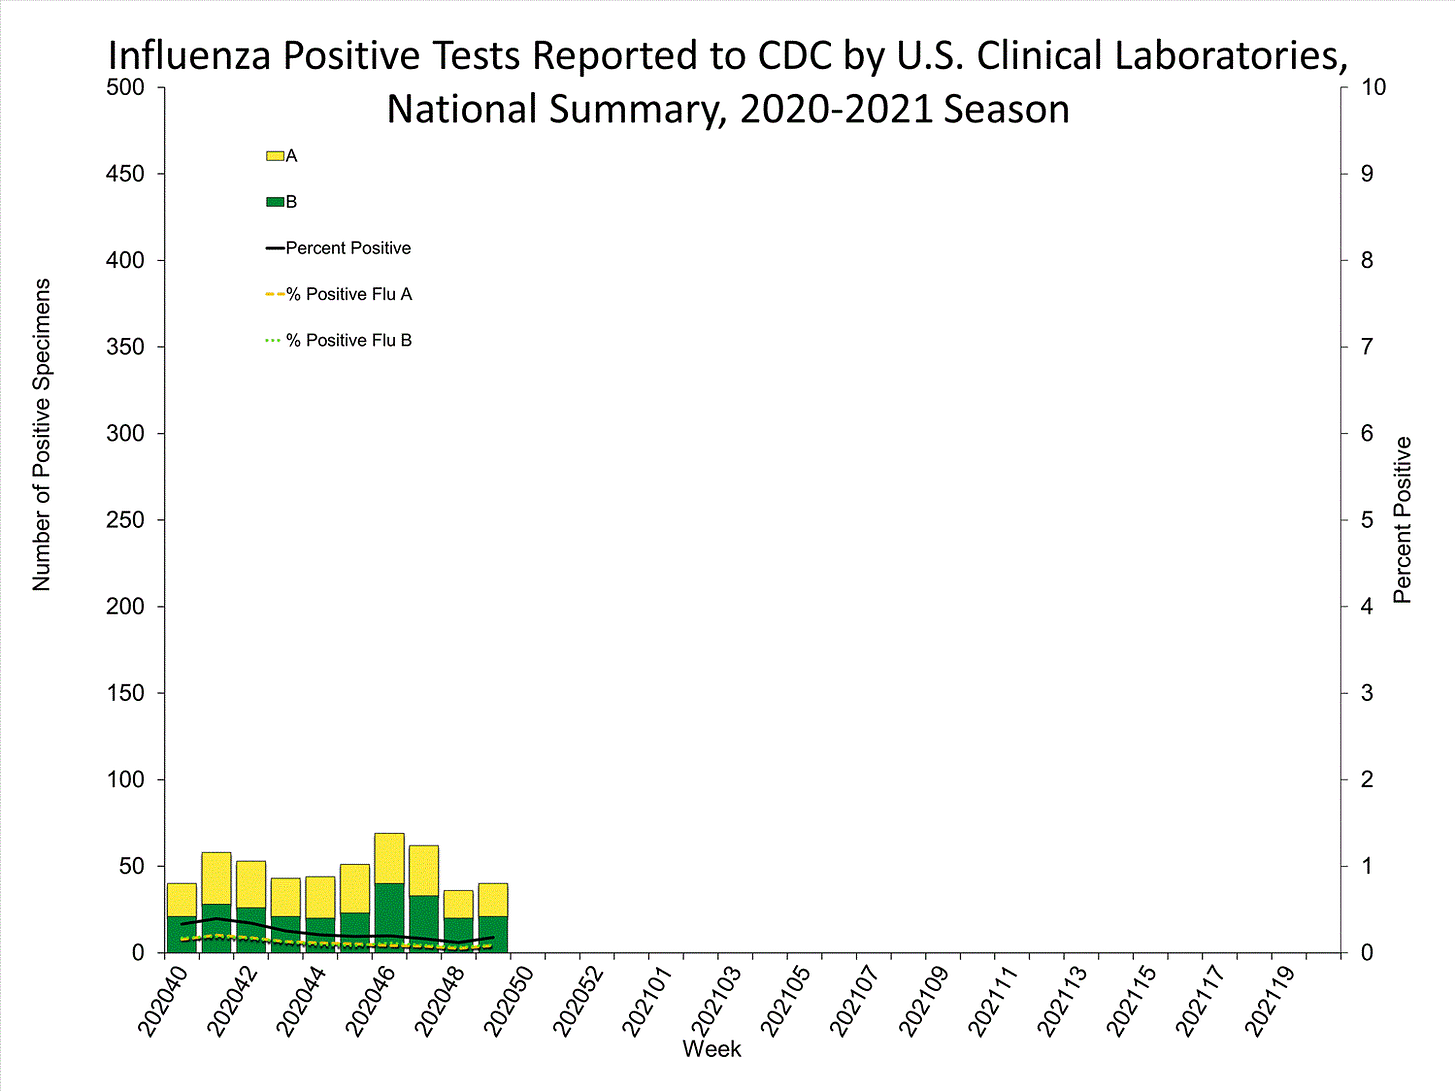
Flu has gone missing. Flu + pneumonia kill about 200,000 each and every year in the US. Not anymore. That is, we don't know any more, because nobody is bothering to check.
Here is the WHO's global flu tracker, showing the same thing:
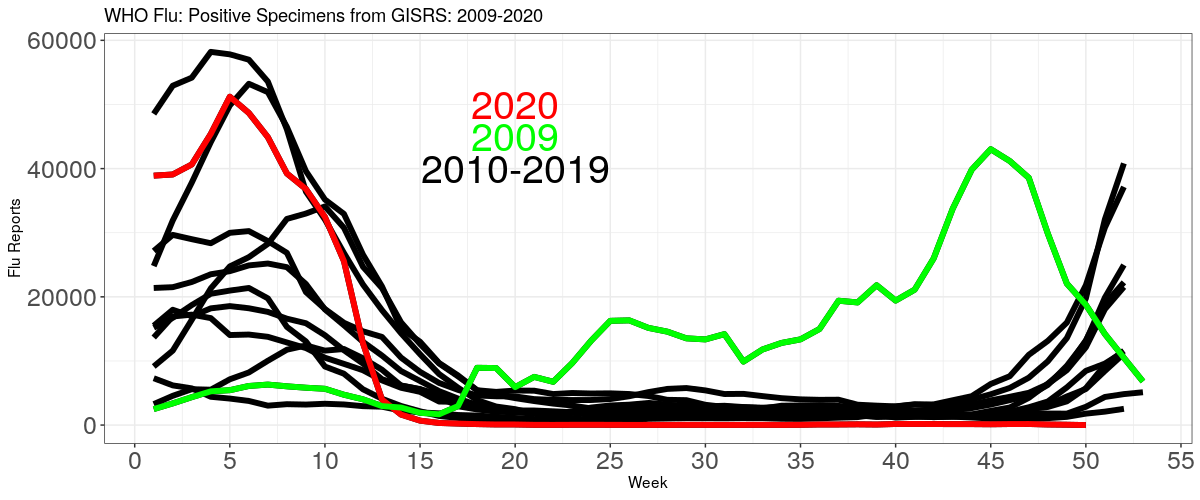
These, like the CDC flu picture are not deaths or illnesses, but counts of positive tests made. Testing has disappeared, because all tests are COVID tests now. Panic destroys thought.
If we focus only on COVID deaths, we lose all perspective. We can see above that deaths peak every January, because of our self-enforced wintertime lockdowns, when we all hunker down inside and spread bugs among ourselves. You may recall that this is also the "solution" many governments hit up to stop the spread of bugs.
Here is the CDC official population mortality rates for the all causes other than COVID, and "involving" COVID (with and of).
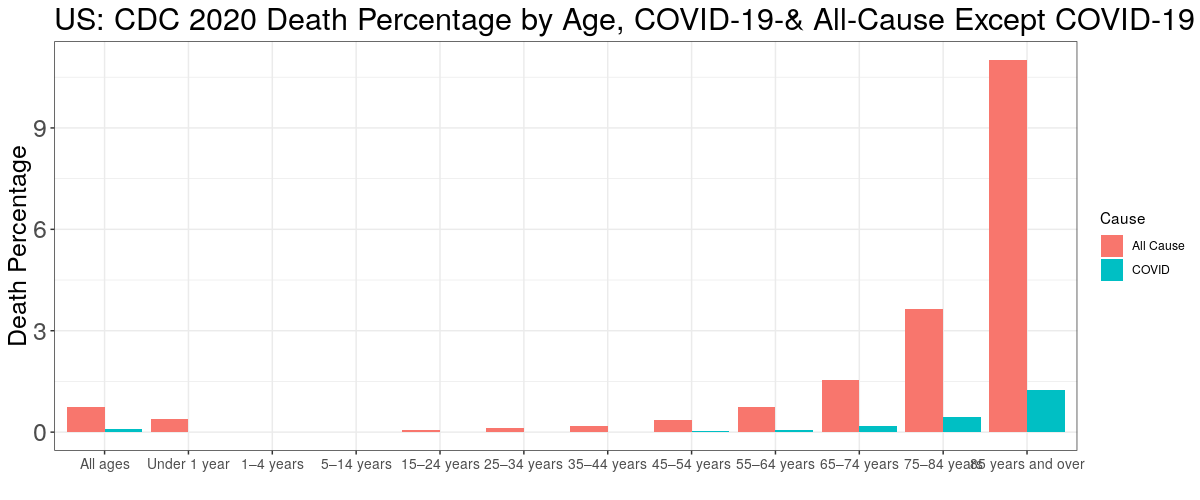
Here are the same population fatality rates in tabular form:
POPULATION FATALITY RATES
                 Age     COVID OtherCause
1       Under 1 year 0.0000077    0.00400
2          1–4 years 0.0000011    0.00018
3         5–14 years 0.0000011    0.00011
4        15–24 years 0.0000110    0.00067
5        25–34 years 0.0000420    0.00130
6        35–44 years 0.0001200    0.00190
7        45–54 years 0.0003200    0.00340
8        55–64 years 0.0007500    0.00760
9        65–74 years 0.0018000    0.01500
10       75–84 years 0.0044000    0.03700
11 85 years and over 0.0120000    0.11000
No matter what age, there is at least about a 10 times or larger chance of dying from something else then COVID.
About masks in depth, see this article and this one.
To support this site and its wholly independent host using credit card or PayPal (in any amount) click here


