COVID Will Be With US Forever, So Calm Down: Coronavirus Update XLII
EFFEMINACY
https://twitter.com/punditclass/status/1333111031103582208
Half of the entire world lost its mind.
https://twitter.com/HansKoppies/status/1333443125881270272
Elderly Woman Euthanized to Avoid Anguish of Lockdown Loneliness
Good morning, Doctor.
"Good morning, Mrs Jones."
Any updates?
"Yes. The good news is that we found a cure for your depression."
Update This is the kind of hersteric effeminacy we're up against. Detroit Free Press: COVID has turned breathing into a deadly event and all of us into potential serial killers. A male wrote this.
BOOK UPDATE
Again, had too busy of a week to do much about the book.
https://twitter.com/JeffSciarappa/status/1331978460097605632
https://twitter.com/RefTheoMatters/status/1332905874659139584 Website of similar name: price of panic.
THE NUMBERS
Sources: daily tests, CDC official toll number one, number two (the old weekly file, now suspect). Deaths by age. Covid & flu. WHO flu tracker. All current as of Monday night.
Daily tests:
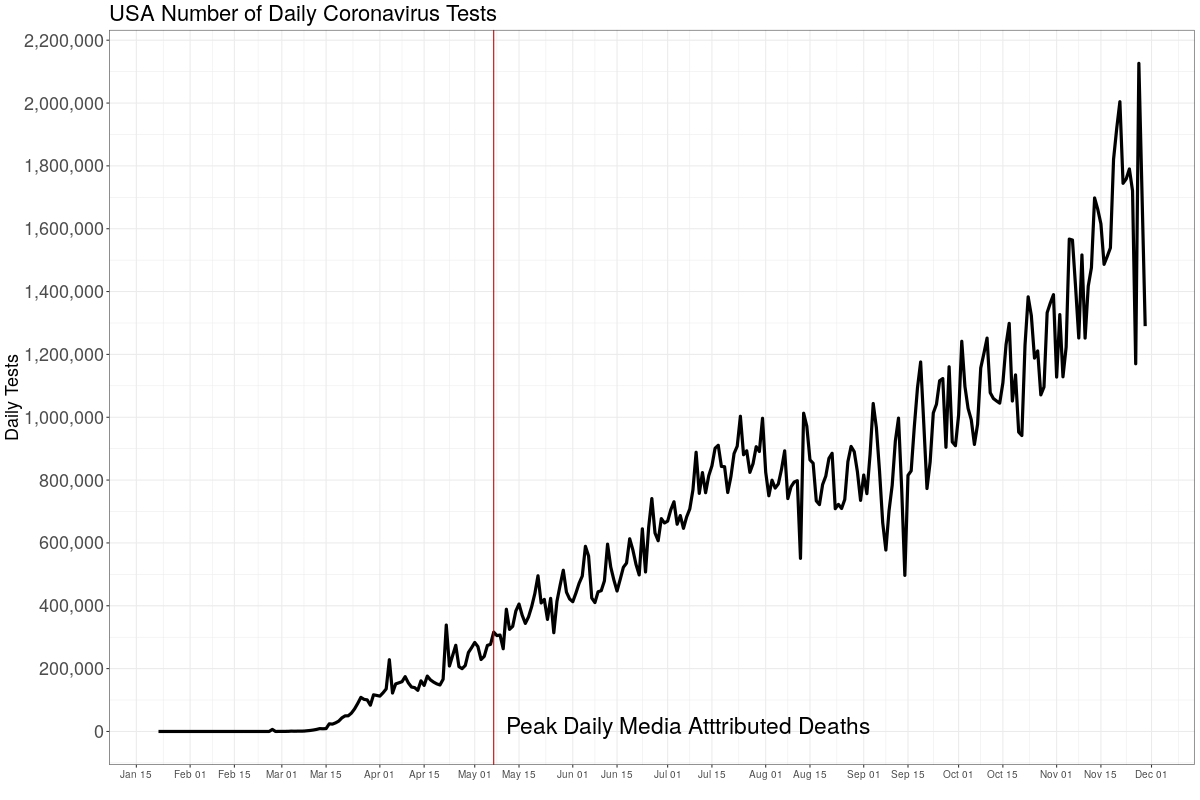
This is the number of daily tests. The date of the media's (COVID Tracking Project) peak attributed deaths is noted: attributed deaths have been steadily declining since then (they will never go to 0).
Topped out just over 2.1 million (data ends Sunday; Monday will be much higher). People obeying the tyranny, and also some realizing their fear was overblown, led to the big up and downs. Many tyrants insisted on testing before traveling. Yet many still joined their loved ones, something government hates. Maybe because it replaces love of them with love of family?
Notice where the peak of COVID deaths were? Testing levels have nothing to do with the actual state of the disease.
Each positive test in the media is counted as a new "case". These are almost all not cases, but merely positive tests, which indicate past infections, current by mild infections, asymptomatic infections, and even no infections at all. False positives.
If testing was at all related to actual deaths, a plot of number of tests per number of deaths should be somewhat flat, all things considered. Here's what the plot looks like in reality:
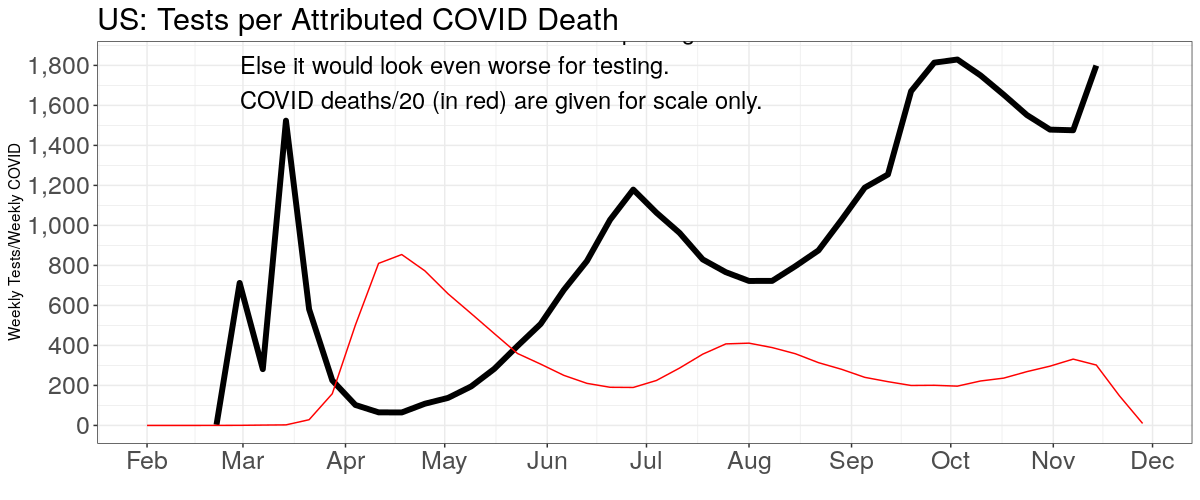
The CDC's COVID deaths (rescaled only to aid in visualization) are there as a guide. Testing continues to soar even as deaths sink to background level. We have lost any sense of proportion.
Here are CDC the weekly attributed coronavirus deaths:
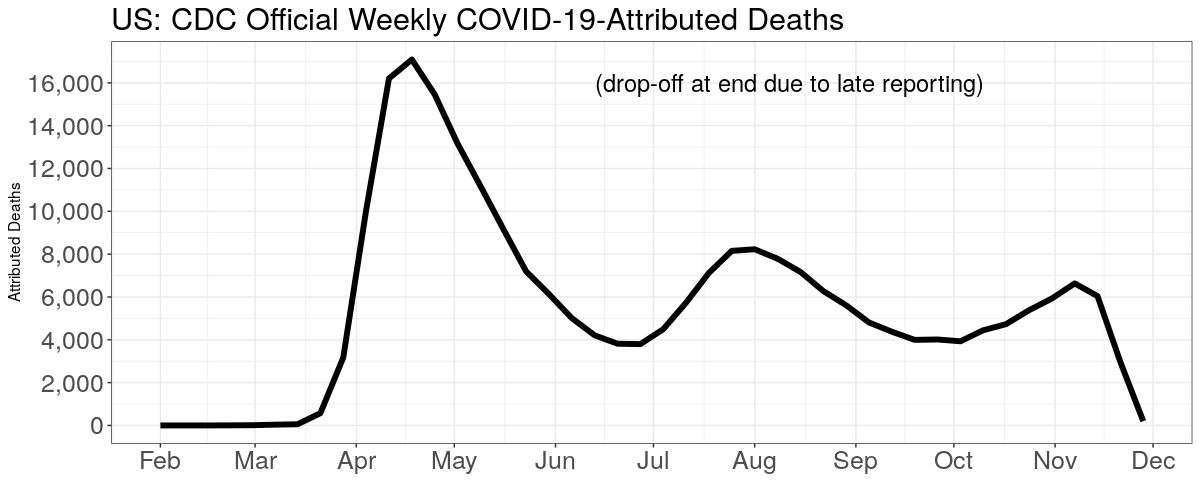
These are attributed deaths, which include all those dying with or dying from the coronavirus. The CDC says deaths "involving" COVID.
Attributed COVID deaths peaked early in the year, and then as it spread to the south, it re-peaked. It is now joining the great chorus of bugs that circulate every winter. It will peak in winter, and subside again in spring. This year's totals will be higher than next year's, and there always be fluctuation, just like with flu.
Here's the CDC weekly ALL CAUSE death counts, or the Perspective Plot. The late drop off is late counting, which takes up to eight weeks to get all, but most are in by three. We need to look at all cause deaths because we can't quite trust the COVID numbers.
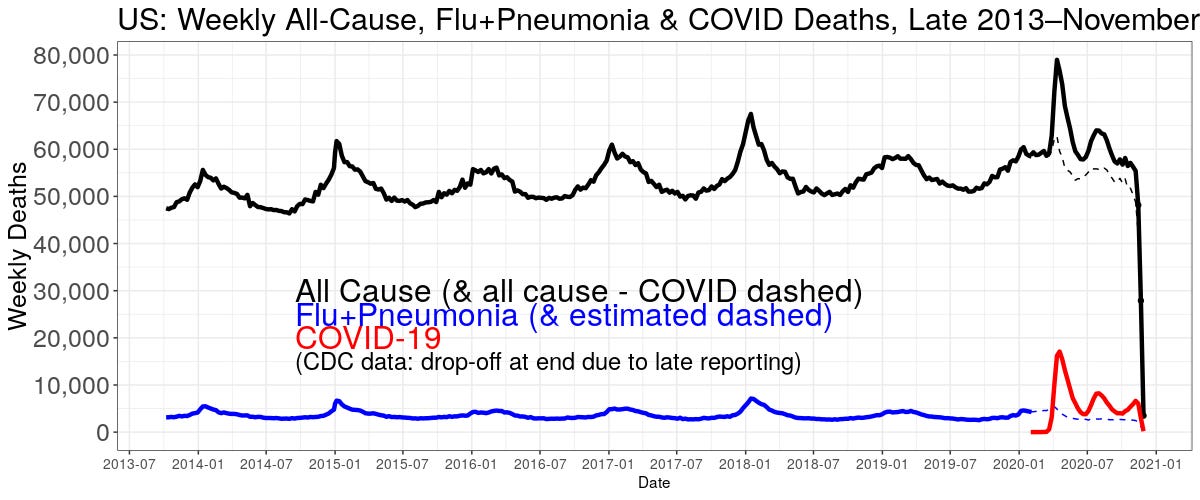
The black line is all deaths, including COVID. Weekly deaths are now at a low, even COVID is small. The dashed is all minus attributed COVID, and the red, for perspective, is COVID. (Again, the drop off is late counts.) The blue line, about the same order as the doom, is flu+pneumonia (it's the pneumonia that kills most flu patients).
The CDC (important!) stopped reporting separate flu and pneumonia deaths midway through 2020, but I estimate them after by subtracting deaths "involving" COVID from those "involving" (their word) pneumonia or flu or COVID. That's the dashed blue line.
Here is another way to look at the same data, week of the year all cause deaths, along with a model (black line) of what deaths would look like without COVID.
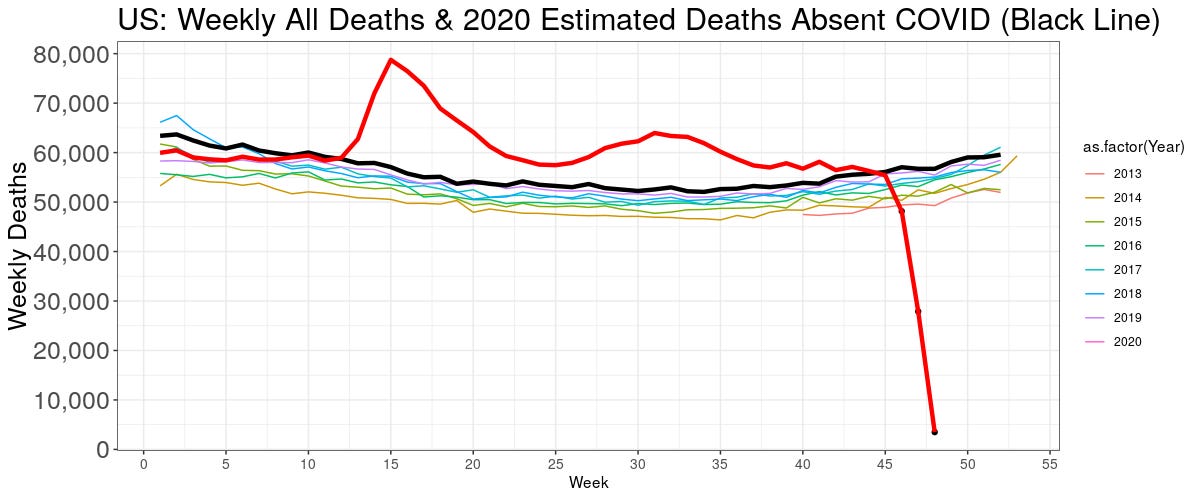
Ignoring the late counts, deaths are exactly where we expect them to be---rather, under where we'd expect them to be.
Same thing is true in Canada, only more so (data source):
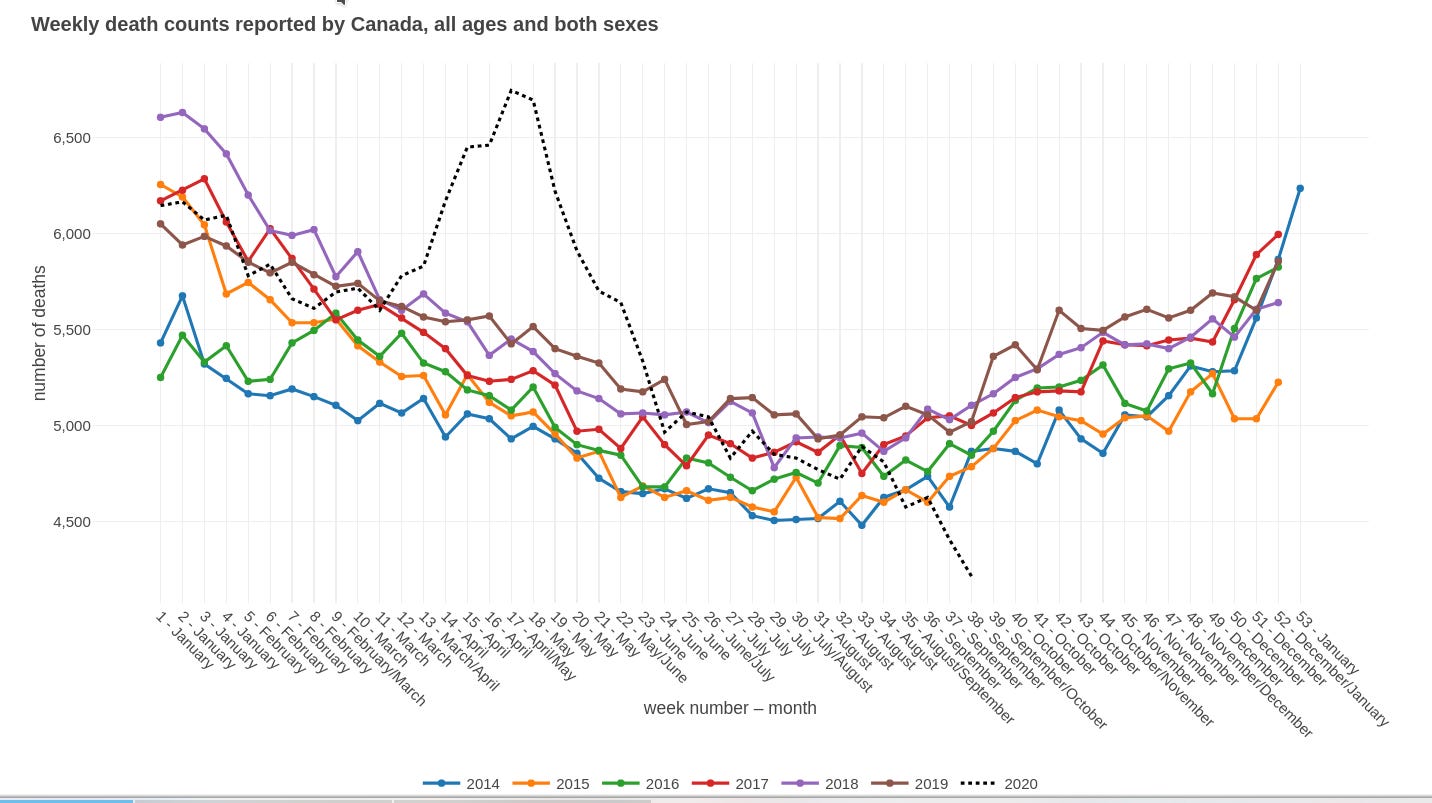
Canadians readers can correct us, but from the many reports we hear, lockdowns and restrictions are worse there than in the States. Even though, as is obvious, conditions are better there.
CDC says "Flu activity is unusually low at this time but may increase in the coming months." Here's their picture of the flu tracking.
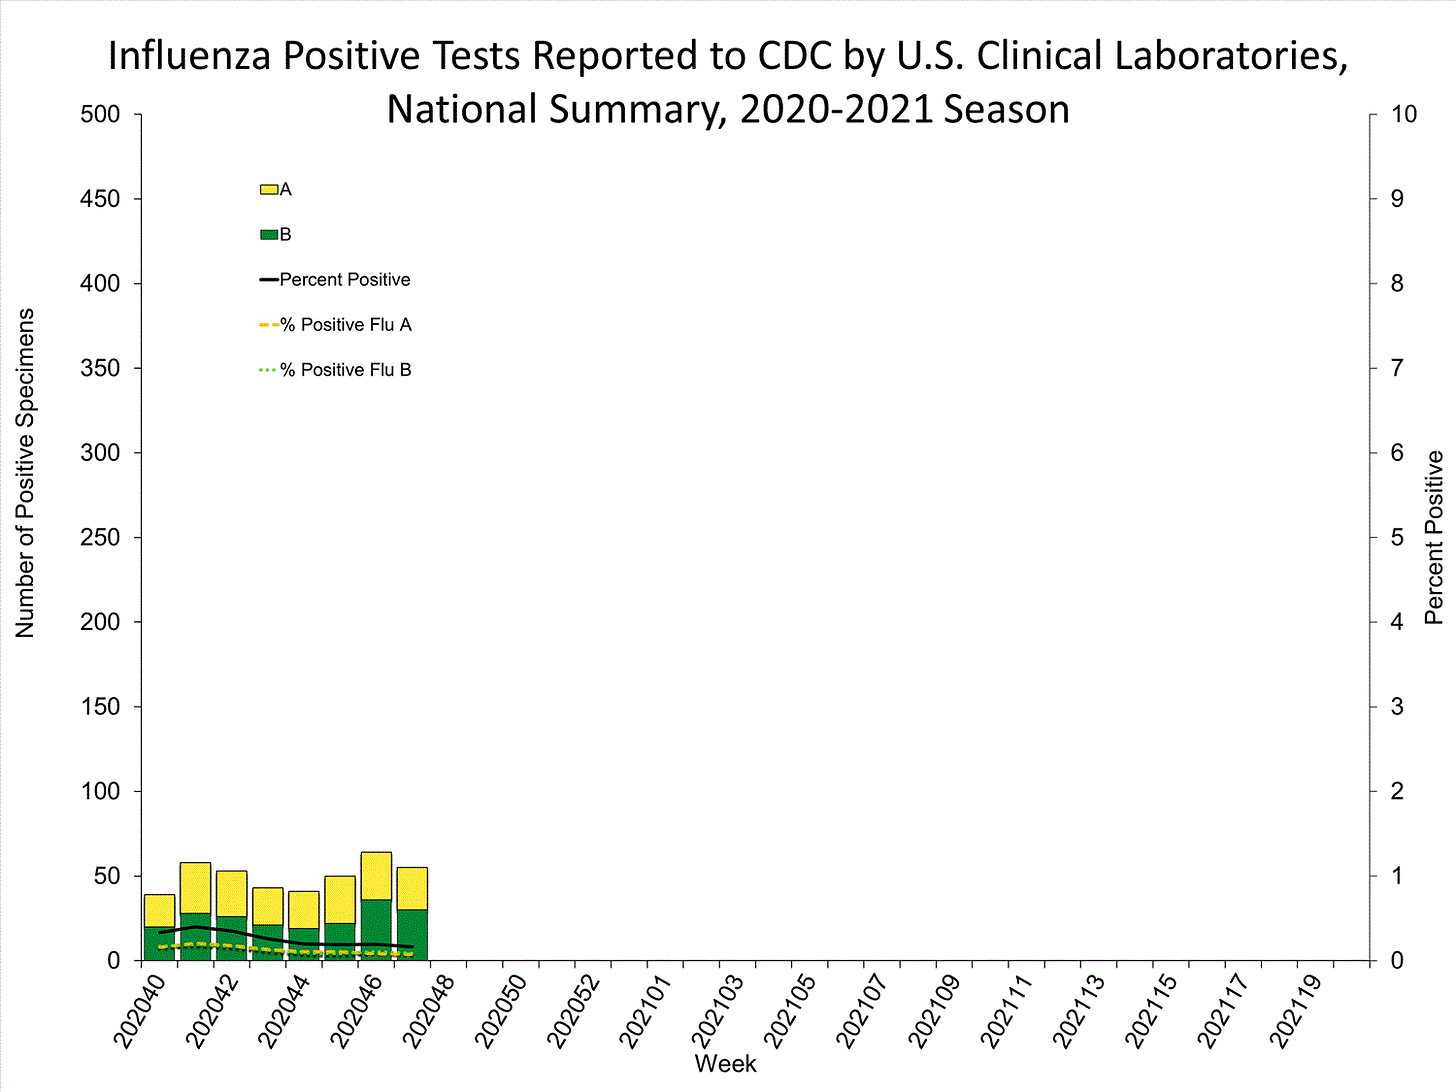
Flu has gone missing. Flu + pneumonia kill about 200,000 each and every year in the US. Not anymore. That is, we don't know any more, because nobody is bothering to check.
Here is the CDC official population mortality rates for the all causes other than COVID, and "involving" COVID (with and of).
Here are the same population fatality rates in tabular form:
POPULATION FATALITY RATES
                 Age     COVID OtherCause
1       Under 1 year 0.0000077    0.00380
2          1–4 years 0.0000010    0.00017
3         5–14 years 0.0000010    0.00011
4        15–24 years 0.0000100    0.00065
5        25–34 years 0.0000390    0.00120
6        35–44 years 0.0001100    0.00180
7        45–54 years 0.0003000    0.00330
8        55–64 years 0.0007000    0.00720
9        65–74 years 0.0016000    0.01500
10       75–84 years 0.0040000    0.03500
11 85 years and over 0.0110000    0.11000
No matter what age, there is at least about a 10 times or larger chance of dying from something else then COVID.
About masks, see this article.
To support this site and its wholly independent host using credit card or PayPal (in any amount) click here


