Mask Me, Darling---Why We Know Masks Don't Work: Coronavirus Update LI
MASKS
The Fabulous Fauci---who likes seeing himself on camera more than Narcissus adored his reflection---was out last week touting triple, or maybe it was quadruple, masks. After all, if one mask protects everybody but you, because the official line is my mask protects you, then two masks protects two other persons beside yourself. Three protects three, and so on.
Or maybe people believe masks protect themselves? Then, as I pointed out on Twitter, since the efficacy of protectiveness decreases logarithmically, then nothing less than an infinite number of masks will protect you 100%.
Now, masks have not worked yet. But they will! We just haven't given them sufficient amount of time to work. Or wait. Maybe they do work. They must. Experts tout them. And these people all have advanced degrees in expertology.
Here, for instance, is the official CDC NYC coronadoom daily attributed deaths.
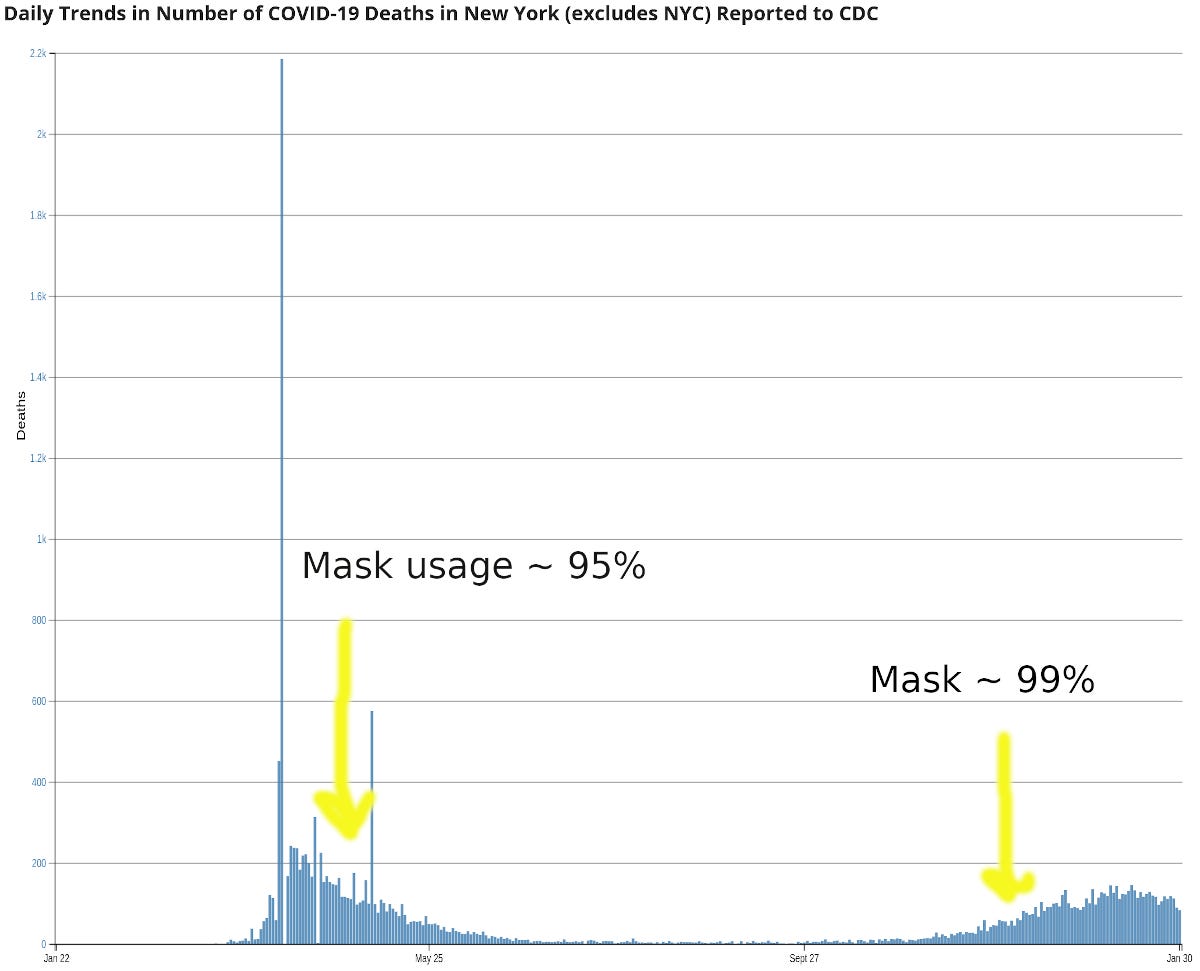
Mask use in NYC was light at first, in March 2020. But by sometime in April it soared to at least 95%. You can see my first-hand observations marked on the plot.
Masks work, and so they cured the doom around June, as you can see. The deaths, after all, went down. Had to be masks. No vaccine then. But there were mask mandates.
Restaurants were semi-open in summer. That must have caused the small number of deaths you see down in the mud of the chart; that constant background. Masks were being worn everywhere still, so it must be the masks were still saving lives. And it must have been open restaurants that were killing people, but only in small amounts.
The cold hit in the fall. Mask usage soared to 98-99%, sometimes to 100% - 1 (me). But deaths began to rise!
Since masks work, the cause of these deaths had to be something else. The only other culprit---which couldn't possibly be the lockdowns or the weather, which causes voluntary lockdowns---had to be restaurants. They were closed.
Well, this is a great scientific discovery, that closed restaurants cause coroandoom deaths! Because masks work, masks work, a scientific conclusion. So the deaths had to have another cause. Somehow, something about the closed restaurants seeped through the masks, and started killing people in earnest.
"But Briggs, you fool. Deaths are decreasing again, as is obvious. Everybody is wearing their masks, which prevents all infections, which is scientifically true. So how can deaths be going down?"
Great question, Science Learner. Easy. Because The Godmother announced that---no, not that he was going to stack nursing homes again, killing more elderly, and winning more awards---but he announced that restaurants would be allowed to open again on Valentine's Day.
"Yeah, so what? They're not open now. Closed restaurants kill fast, as we have seen, and it's only open restaurants that kill people slow."
Right. That can only mean the to-be-opened restaurants are producing, from the future, some kind of tachyon-coronadoom canceling signature.
"That's amazing! Surely you'll get the Nobel for this."
I'd turn it down. I'm too modest to accept.
"You are humble, it's true. So the real conclusion is that masks work?"
Certainly. They wouldn't keep saying masks work unless masks work.
My only advice is that be sure your medical technician doesn't mix up your anal and nasal swab when you get your test.
Update As I was posting this morning, the radio say "good news" in "worst ever" pandemic (false), "cases and hospitals are plummeting". Yes, the p-word. Election effect.
Update Tip from Darren Nelson: Wisconsin's Mask Mandate Hasn't Worked and Here's the Proof
VACCINE
The Johnson & Johnson vaccine is out. Unlike the other, more radically experimental mRNA vaccines, this one is seemingly more old-fashioned. Simplified: takes an ordinary coronavirus (which causes the common cold) and modifies its DNA to mimic a dumbed-down version of the coroandoom virus.
This vaccine has touted efficacy rates much lower than the others, but also more believable. They say those who get the doom with it are less sick.
I haven't had the chance to review the safety data yet. But the vaccine itself has fewer question marks.
More coming on this.
BOOK UPDATE
The book is back in stock! The Price of Panic.
The price is still $12.99 for the hardback. You can't afford not to buy.
New review: here.
Website of similar name: price of panic.
THE NUMBERS
Sources: daily tests, CDC official toll number one, number two (the old weekly file, now suspect). Deaths by age. Covid & flu. WHO flu tracker. All current as of Monday night.
Here are the daily tests:
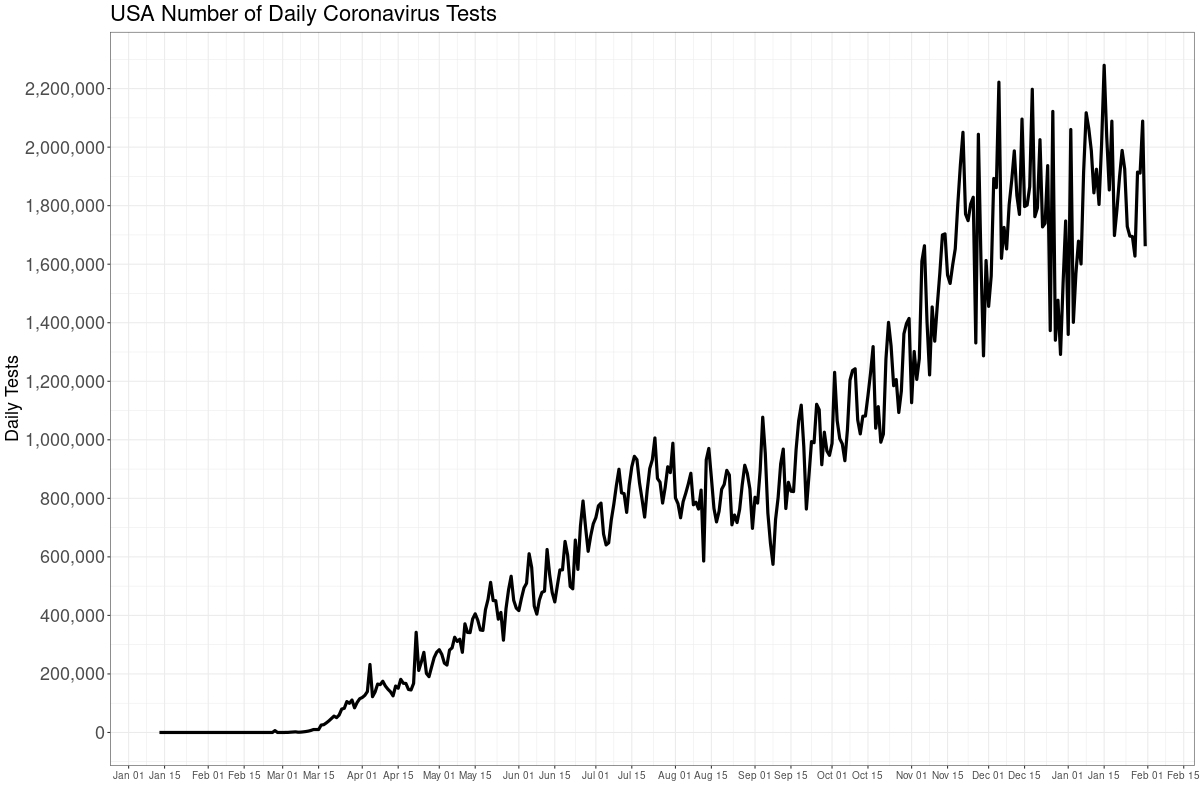
Good news is the testing has gone down a bit. Perhaps the vaccine news has calmed people from seeking tests. It's still at nutty levels.
Every positive test the media falsely calls a "case", when it is only an infection with varying degrees of seriousness---and most are not serious. The media really does not know how to tell the truth.
Here's the other good news, the positivity rate of the tests. You'll recall last week we discussed how the WHO told people to lower the PCR Ct rates, which should produce fewer positives---and fewer false positives.
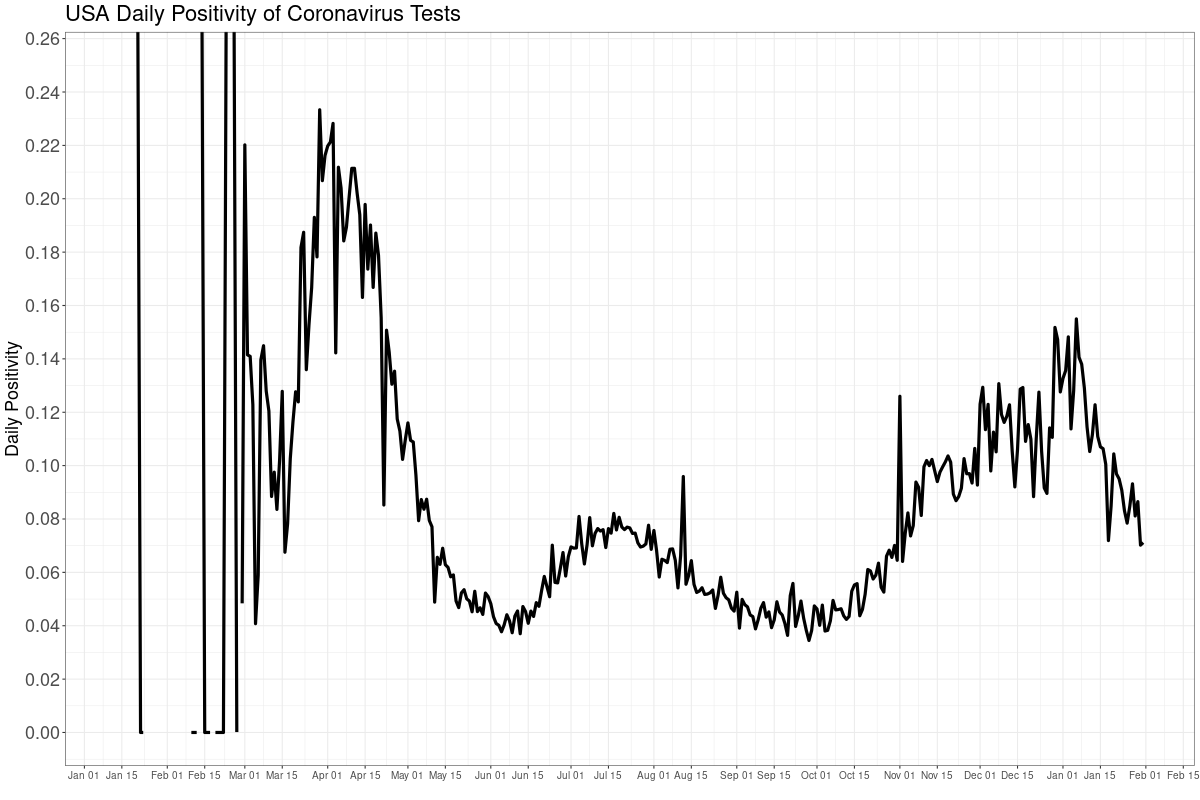
Notice carefully this chart has nothing to do with the number of tests. Positivity wouldn't, per se, fall because testing fell.
Fewer official positive tests mean, necessarily, fewer attributed coronadoom deaths, and also fewer "cases" (infections).
What is causing this? The lowered Ct is certainly part of this. But also the weather, as you'll see next. Deaths of all diseases always drop starting the end of January. The vaccines, even though not widely administered, likely accounts for some of the drop, too.
My guess is the order of importance of cause is: lowered Ct, weather (maybe tied), and vaccines. Still too early to tell about vaccines.
CDC weekly ALL CAUSE death counts, or the Perspective Plot, from late 2009 until now. The late drop off is late counting: it takes up to eight weeks to get all data. We need to look at all cause deaths because we can't quite trust the attributed COVID numbers.
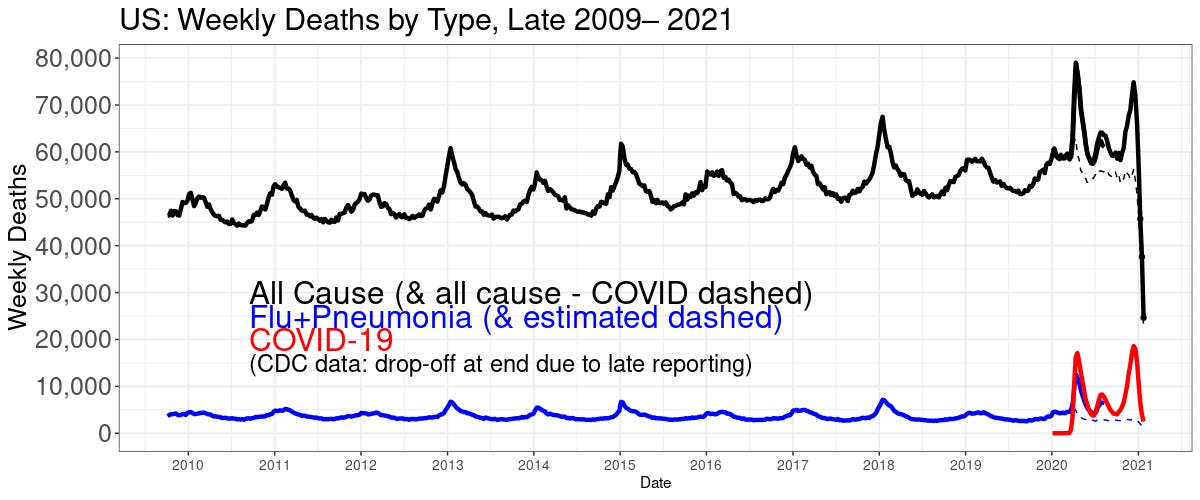
The black line is deaths of any kind. The red is COVID. The blue line is flu+pneumonia (it's the pneumonia that kills most flu patients). The blue is estimated starting mid year 2020 because CDC stopped separate reporting on flu. The suspicion is some flu and pneumonia deaths are being attributed to COVID.
You can see the initial peak in 2020, when the virus first hit in the northeast, and then a smaller bump when it spread south and west. The current January bump now is in line, and perhaps a bit higher, with what we expect to see this time of year.
DEATHS ALWAYS PEAK IN MID JANUARY, THEN DROP. EVEN WITHOUT GOVERNMENT INTERVENTION. PLEASE PASS THIS INFORMATION ON!
The January peaks are caused when we enter our voluntary lockdowns in winter, spreading bugs. This is also the "solution" governments hit upon to stop the spread of bugs. Lockdowns kill.
Here is the CDC deaths "involving" COVID.
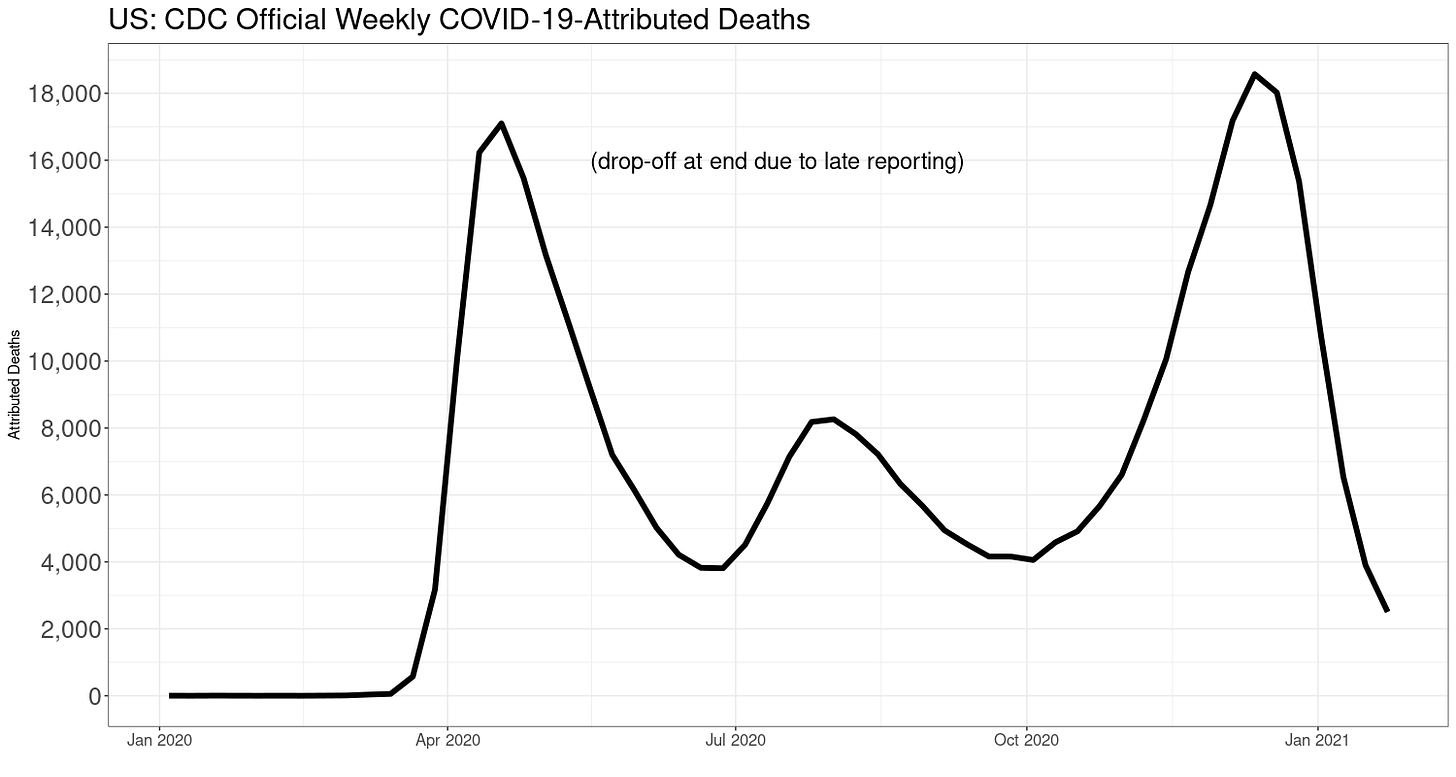
Even with late counting it's clear attributed deaths are on their way down---as we have been predicting. There is also concern some of these attributed deaths are flu or pneumonia and not COVID per se.
Here is another way to look at all deaths, the week-of-the-year all-cause deaths.
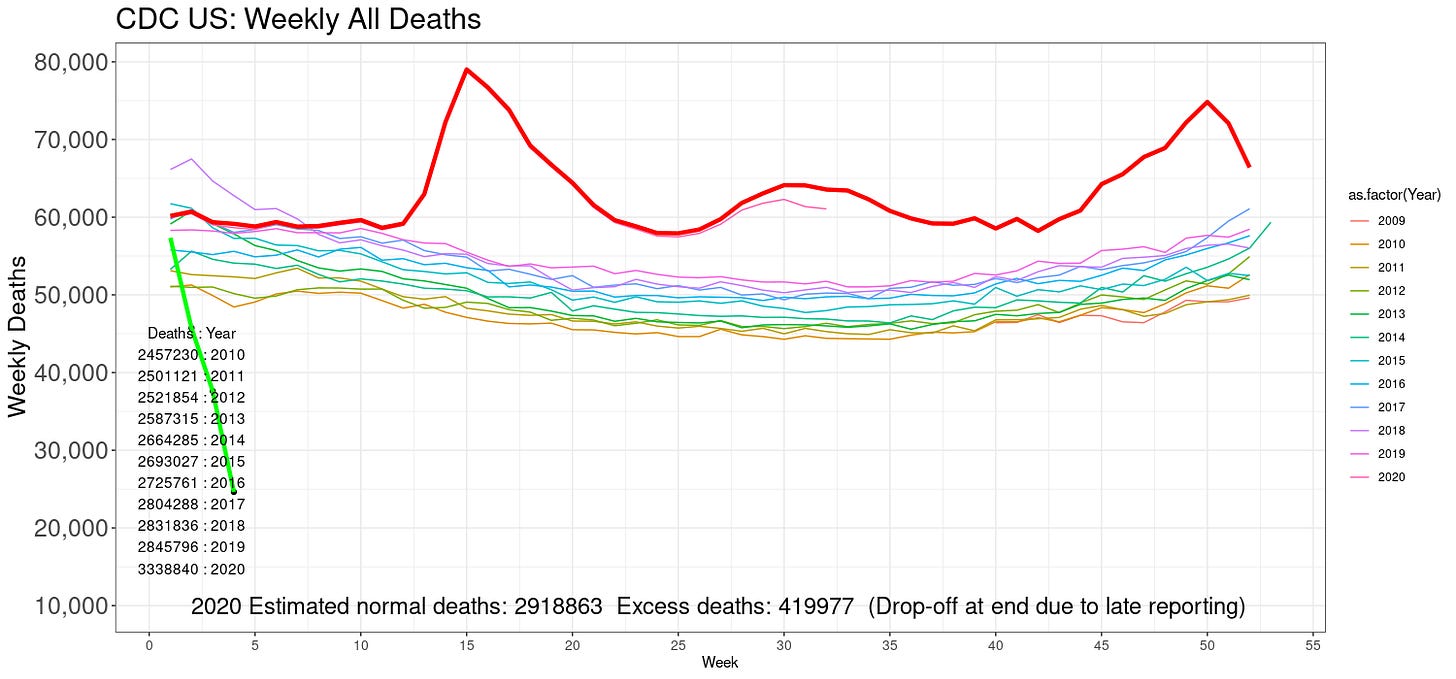
The 2020 estimated "excess" deaths (using my extrapolation model) are closing in. About 420 thousand. This will rise a bit with late counts.
IMPORTANT: these are not all COVID deaths! They include deaths from the "solution" to COVID, too. Plus increased suicides, septicemia and other iatrogenic kills, cancers, heart attacks, and everything else due to lockdowns.
The green line at the left are 2021 numbers; obvious under-counts. I include them to show where we are.
Flu is still missing, even into 2021. CDC found one pediatric death for flu this season. Here is the WHO's global flu tracker, which still shows flu has gone missing everywhere:
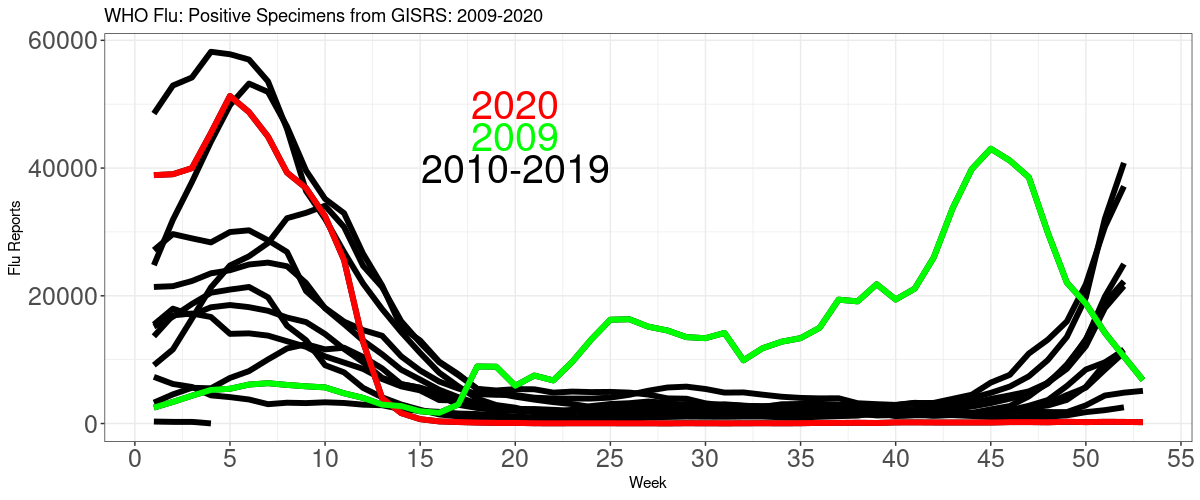
The black line at the bottom far left is 2021. Flu is still gone the whole world over. Leading us to suspect some COVID deaths are really flu+pneumonia.
Here is the CDC official population mortality rates for the all causes other than COVID, and "involving" COVID (with and of; "involving" is CDC's word).
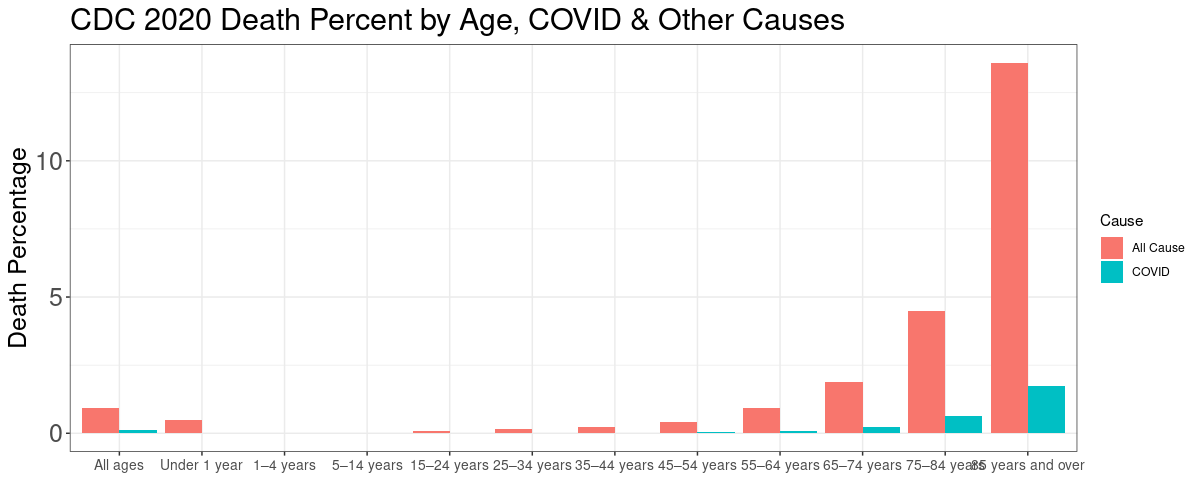
Here are the same population fatality rates in tabular form:
POPULATION FATALITY RATES
                 Age     COVID OtherCause
1       Under 1 year 0.0000110    0.00490
2          1–4 years 0.0000013    0.00021
3         5–14 years 0.0000014    0.00013
4        15–24 years 0.0000130    0.00081
5        25–34 years 0.0000510    0.00150
6        35–44 years 0.0001500    0.00230
7        45–54 years 0.0004100    0.00420
8        55–64 years 0.0009900    0.00930
9        65–74 years 0.0024000    0.01900
10       75–84 years 0.0062000    0.04500
11 85 years and over 0.0180000    0.14000
No matter what age, there is at least about a 10 times or larger chance of dying from something else then COVID. If you're under 44, the COVID risk is tiny. Our level of fear is in not in line with the actual risk for the majority of the population.
About masks in depth, see this article and this one. I am also working on a comprehensive article about masks. Hint: they do not work.
To support this site and its wholly independent host using credit card or PayPal (in any amount) click here


