An Electoral Train Wreck In Progress -- Guest Post by Young, Droz, Davis & Belhar
S. Stanley Young, John Droz, Tom Davis, and Ray Belhar for The Science Team
I am reporting for a pro bono team of computer scientists and statisticians, The Science Team. We have now worked out how absentee votes for Trump were transferred to absentee votes for Biden. We can track the change in votes, data move by data move. A New York Times website gives vote increase and decreases for each candidate that occur during the vote-counting process. Essentially all the data we use is public, so our work is verifiable.
Unfortunately, there appear to be a deeply flawed voting process in several states, so The Science Team feels like observers of a train wreck in progress. How it all happens is a puzzle. What are the shapes of the puzzle parts? What are legitimate puzzle parts? And how do the real parts fit together? First, we list some of the puzzle parts, then we describe how they fit together, and finally we give an example figure confirming that the puzzle is solved.
Puzzle parts
Puzzle Part 1: Down ballot voting. Down ballot voting results in Allegheny County Pennsylvania gives insight into the voting process. Inconsistencies between presidential votes and down-ballot voting point to systematic problems. Biden and Trump lead their tickets; Shapiro and Heidelbaugh are respective candidates for state attorney general. Vote totals are given in Tables 1 and 2.
Table 1. Trump and Heidelbaugh.
Trump Heidelbaugh Election Day 209,459 183,538 Absentee 67,164 57,436 Provisional 6,290 5,279 Total 282,913 246,253
Table 2. Biden and Shapiro.
Biden Shapiro Election Day 148,171 161,321 Absentee 274,774 273,725 Provisional 7,814 8,120 Total 430,759 443,166
First note that Trump leads the ticket, with fewer votes for Hidelbaugh. Next notice that Biden votes are lower by 13,150 than for Shapiro. One might conjecture that Biden is less popular than Shapiro, but that is not supported with the Absentee vote where Biden received 1,049 more votes than Shapiro.
Chance is not at play. You are roughly 100,000 times more likely to be struck by lightning in a year than come upon a table this unusual. There is something systematic; perhaps the Biden absentee vote count was systematically augmented.
Puzzle Part 2: Time series of data additions. Vote counting was stopped the night of 3 November, itself a quite unusual event, and over 100,000 absentee votes were later deposited. Also, strangely, several other states stopped counting votes at the same time and later, also at about the same time, made large deposits of absentee votes. Careful examination of vote movements shows votes were removed from Trump and placed with 3rd party candidates, then moved to Biden.
Puzzle Part 3: Under a court order voting machines in Antrim County Michigan were examined by a computer expert, Russell Ramsland Jr. of Allied Security Operations Group. He found that Dominion’s voting system “intentionally generates an enormously high number of ballot errors,” causing the ballots to enter a process known as adjudication. “The intentional errors lead to bulk adjudication of ballots with no oversight, no transparency, and no audit trail.” The word intentional needs comment. A second computer expert, Navid Keshavarz-Nia, noted that “... Hammer and Scorecard capabilities are tradecrafts used by US intelligence analysts to conduct MITM (man in the middle) attacks on foreign voting systems...without leaving an electronic fingerprint.” The existence of this software and the code was released in Wiki Leaks.
There are other puzzle parts that fit, but these are sufficient for out purposes.
How the puzzle parts fit together: Here is our current explanation on how it went down. Once the results of in-person voting were known, the allocation could be determined to overcome an in-person shortfall. The Biden/Trump percent absentee ratio, before allocation, might be 60/40 and during allocation to be as high as 80/20.
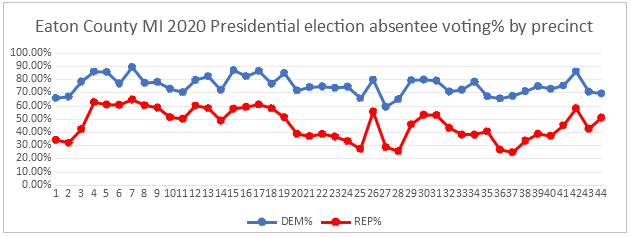
Results: We examine the percent of each candidates vote that come from absentee votes. Based on allocation, the final Biden and Trump percent absentee will become more extreme and, most curiously, will vary together in what we call a “snake diagram.” We give a snake diagram for Eaton County Michigan.

Among the unusual features of this figure is the general tendency of the snakes to go up and down together. The correlation between the two variables is 0.8138 and with a p-value of 1.86x10⁻¹¹, about 35 consecutive heads coin-flips. We will think the synchronization is due to the allocation process until someone offers a better explanation.
Scaled and replicated
A computer operation scales to almost any size and can be replicated at will. If the ballot results are sent to a central computer, an algorithm can be used to “adjudicate” and reassign results to candidates.
Multiple counties within battleground states, e.g. Georgia, Pennsylvania, Michigan, give parallel snake diagrams.
To support this site and its wholly independent host using credit card or PayPal (in any amount) click here


